Difference between Arsenal, Liverpool and Manchester city on the pitch in the 2021/2022 season through the statistics.
After analysing nine leagues in Europe (TOP5+Austria, Belgium, Croatia, and Poland) (https://www.linkedin.com/pulse/do-leagues-generally-differ-between-themselves-pitch-slaven-marasovi%C4%87) based on a survey conducted on LinkedIn I have analysed three clubs from Premier League in the season 2021/22: Manchester City, Liverpool and Arsenal. So, how do these three clubs differ on the pitch based on the statistical data and analysis? Could you read the playing style from it? Their strength and weaknesses. What could be the benefits of this kind of analysis? Could clubs use it to improve their strengths and reduce their liabilities or to recognize it in opponents’ games? Could players use it for identifying the best clubs for their signings? Maybe it could be interesting for journalists to analyse matches…?
To answer those questions, I have used four criteriums:
1. What are the key factors to create a chance in the individual club?
2. What are the key factors on the pitch for scoring a goal in the individual club?
3. What are the key factors on the pitch for not losing the game in the individual club?
4. What are the key factors on the pitch for winning a match in an individual club?
To describe those four criteriums I have used:
1. frequency (what is most used in each league),
2. statistical correlation and
3. statistical regression.
As we stated in the prior article, the frequency of 104 observed aspects of the game will tell us which aspect of the match is happening the most. That will not help us understand how to reach each of the criteriums.
On the opposite, the statistical correlation will tell us what correlates with each of the criteriums and help us start understanding each of criteriums per country. So, more interesting will be those aspects of the game which have a stronger correlation with each of the criterium.
Regression models will indicate us what is specific for reaching each of criteriums per each country and help us better understand each of criteriums. For the best understanding of each country will be summarized correlations and regression models as prepared for interpretation.
If you want to read more about regression models just go on the above-mentioned article https://www.linkedin.com/pulse/do-leagues-generally-differ-between-themselves-pitch-slaven-marasovi%C4%87 .
I will provide you insights and interpretation will live for you. Also, I can announce the interpretation of this data by an expert @Goran Rosanda, so, stay tuned.
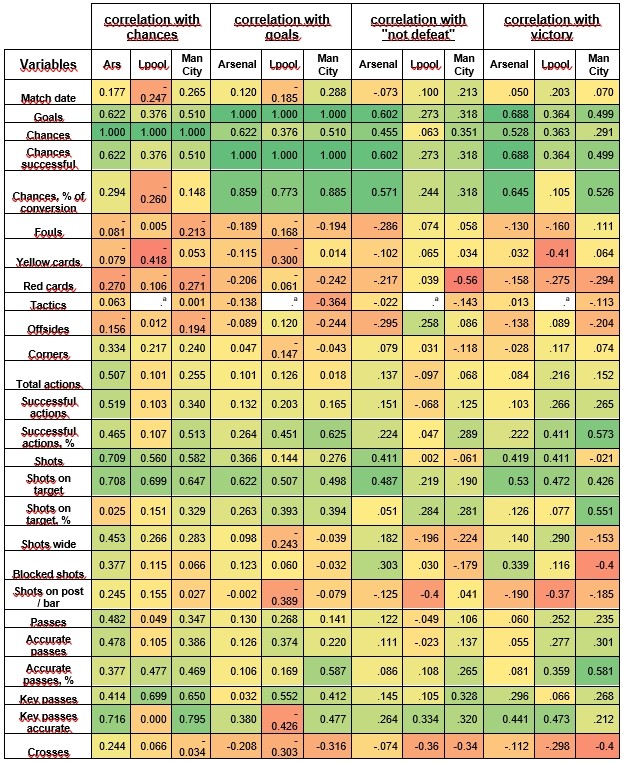
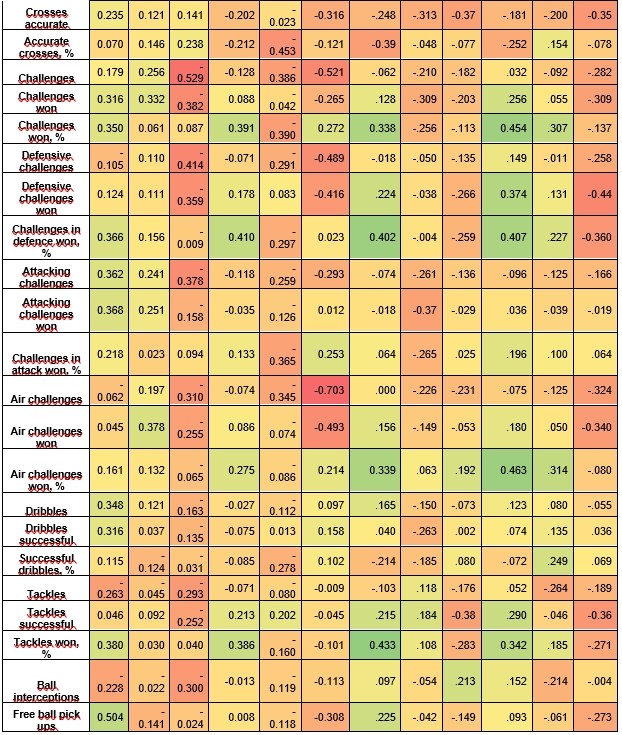
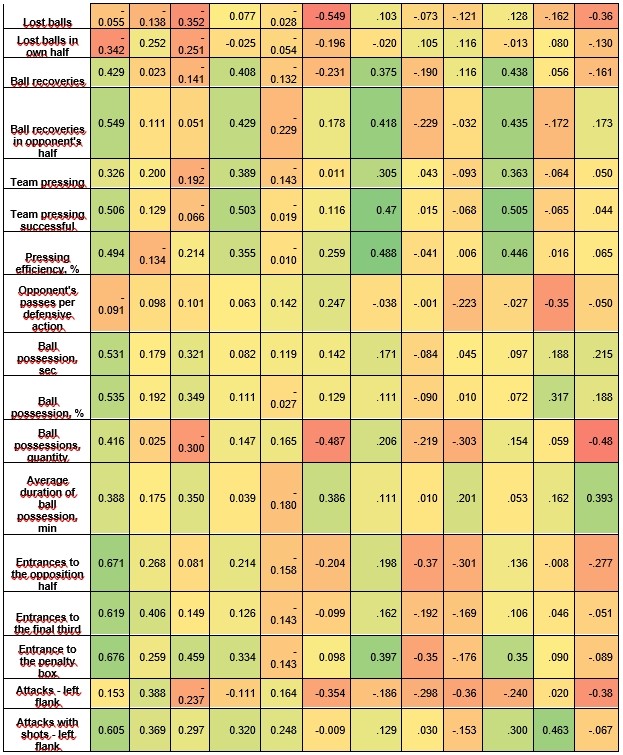
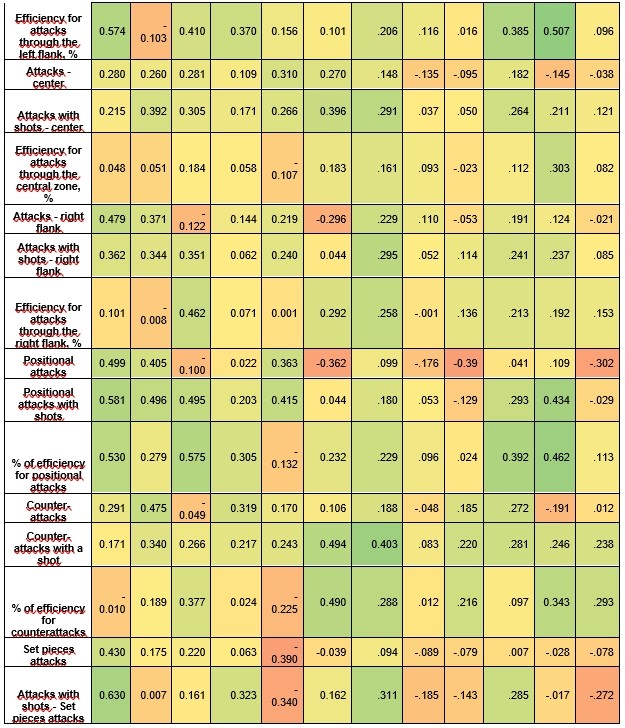
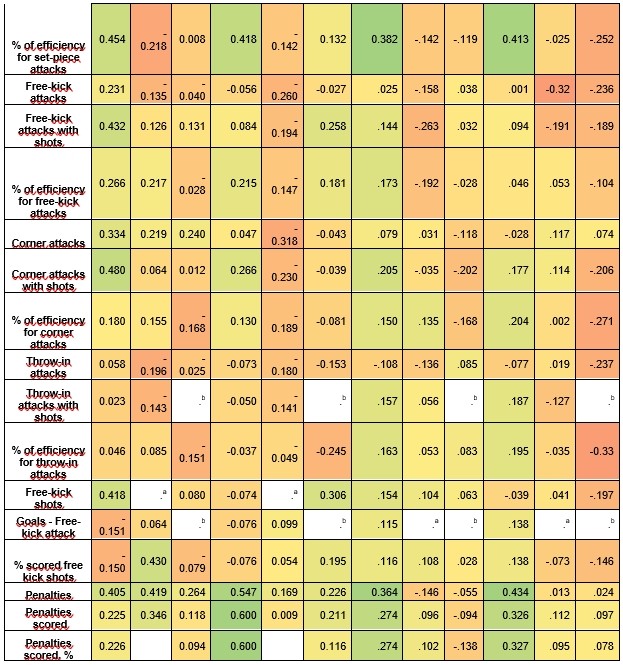
In the following heatmap of correlations of different aspects of the game are presented. So, let’s start with correlations between “creating a chance”, “scoring a goal”, “not losing a match” and “winning a match” and different aspects of the game per each club. It was very interesting to go through each correlation and notice the differences, so I advise you, if you find this topic interesting, to go through it. That’s why I will provide all correlations to you (without xG related). Each aspect of the game is interesting and if you combined one aspect of the game with another you can have interesting conclusions. For the practical side and size of this text, I will focus just on the obvious differences in the game between the clubs.
The yellow card’s most negative influence on the Liverpool game and correlation is much (negative) higher than for the other two clubs, while the red card’s most negative influence has on the Manchester City game. Manchester City is having the most negative correlation with offsides (have a look at Liverpool in the “not defeat” category”). The percentage of successful actions is most important for Manchester City, while the number of shots and shots on target is for Arsenal. Again, per cent of shots on target is having the most positive influence on Manchester City’s game. Further on, blocked shots have a negative influence on the Manchester City game. There is an interesting difference between Liverpool and the other two clubs relating to key passes accurate. While Arsenal and Manchester City have an extremely high positive correlation with creating chance (+0.7), Liverpool does not have any correlation at all (0.0). For goals, Manchester City and Arsenal are having very positive correlation (0.4) while Liverpool is having very negative (-0.4). In “not losing the game” and “winning the match” Liverpool is having most positive correlation.
Per cent of accurate passes is most important for Manchester City games, and crosses, challenges and challenges won are having the most negative influence on the same club. On the other side per cent of the challenges won is having a positive influence on Arsenal’s game. Also, defensive challenges and defensive challenges won are having a mostly negative influence on Manchester City games. This does not mean that winning challenges in defence is bad but keeping Manchester City defending and under-pressing is negatively influencing their performance. It is not easy to do, obviously, but that’s the description of how they have been not winning and losing games.
Manchester City also does not like football “in the air” since they are having very different correlation in air challenges and air challenges won than Arsenal and Liverpool. In Manchester City, it is very negative. On the other side, Arsenal is having a positive influence in winning air challenges with victory and not losing the match. Successful tackles are having the most negative influence on the Manchester City game again as same as lost balls. Ball recoveries are having a most positive influence on Arsenal’s game, same as ball recoveries in the opponent’s half, team pressing, team pressing successfully and per cent of pressing efficiency. Ball possession quantity is having the most negative influence on the Manchester City game while the average duration of ball possession is having the most positive influence on the Manchester City game. This might indicate that in games in which Manchester City had a lot of possession whit small average possession of the ball possession and with a lot of interruption in actions from the opposite team. Attacks on the left flank are most negative for Manchester City and most positive for Liverpool. The positional attack is the most negative for the Manchester City game the same as per cent of efficiency of throw-in actions. Liverpool “does not like” free kicks with shots because it has a negative influence on their game. Penalties have a positive influence on Arsenal’s game.
Table 1.: Heatmap of correlations between chances and different aspects of game per each club
The following models will indicate to us what is specific for reaching each of the criteriums and for each club. In each of the tables for regression models, green will be marked aspects of the game which have a statistically positive significant correlation, red will be marked aspects of the game which have a statistically negative significant correlation and those aspects of the game which don’t have any statistically significant correlation will not be marked.
It is interesting that some clubs’ models have fewer independent variables and in some more. It might be that in clubs with fewer variables, independent variables are more influential on dependent variables than in models with more independent variables in the model. It means that experts would have fewer variables to focus on if they would use this model to improve chances, and goals, not being defeated or winning. Also seeing variables in chances, one can see what each club is focused on. It might be interesting for planning matches or for opponent teams playing games against such clubs.
Regression models for “create a chance”
Adjusted R square is very strong (very high) for the “create chance” criterium, for all clubs. It goes from 0,808 for Liverpool, over 0.877 for Manchester City till 0.926 for Arsenal. Only key passes – accurate and penalties are present in all models.
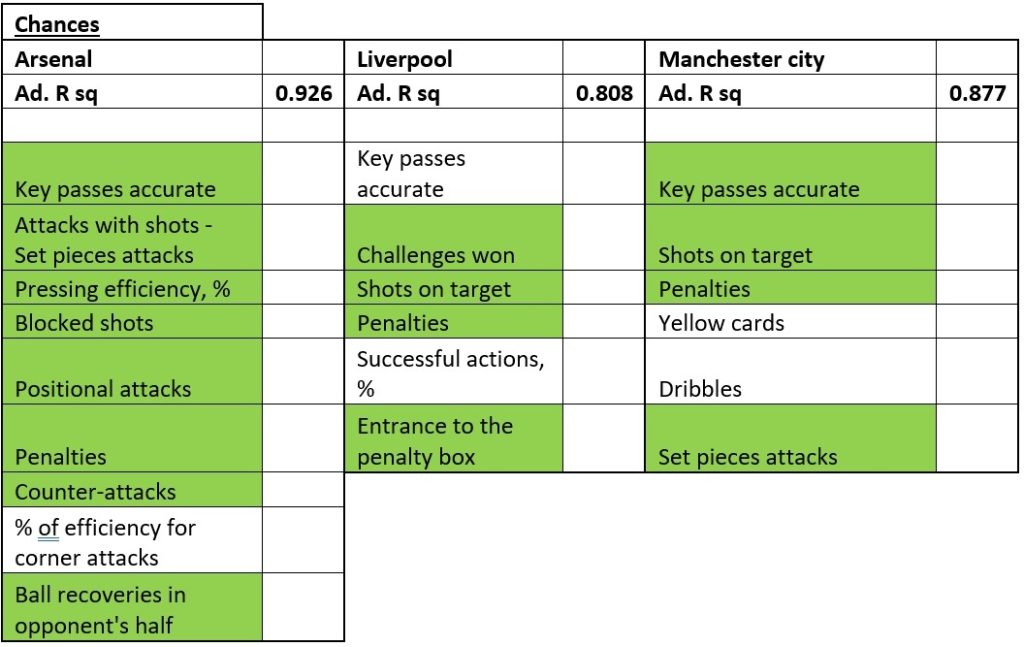
For creating chances for Arsenal, it is important to have efficient pressing, ball recoveries in the opponent’s half, counter attacks among others. Arsenal has attacks with shots – set pieces attacks while Liverpool has entrance to the penalty box with shots on target and Manchester City has set pieces attacks, dribbles, key passes accurate and shots on target. It might be observed from the perspective of distance from goal and from the perspective of how they “materialize” chances. It seems that Liverpool and Manchester City are more similar than Arsenal is with these two clubs. It could be argued that the difference between Liverpool and Manchester City is by “principle” how they “approach” the chance. It might be that Liverpool is reaching the penalty box by actions before the shot while Manchester City also use dribbles before chance not just from the penalty box.
Regression models for “score a goal”
To score a goal is more difficult to predict than to make a chance. Still, the adjusted R square is strong above 0,600. On the other side, in models for “goals” is much more variables with a negative significant Pearson correlation. Have in mind to see those variables as those which should be reduced in the potential game plan. There is no single variable which is common for all clubs.
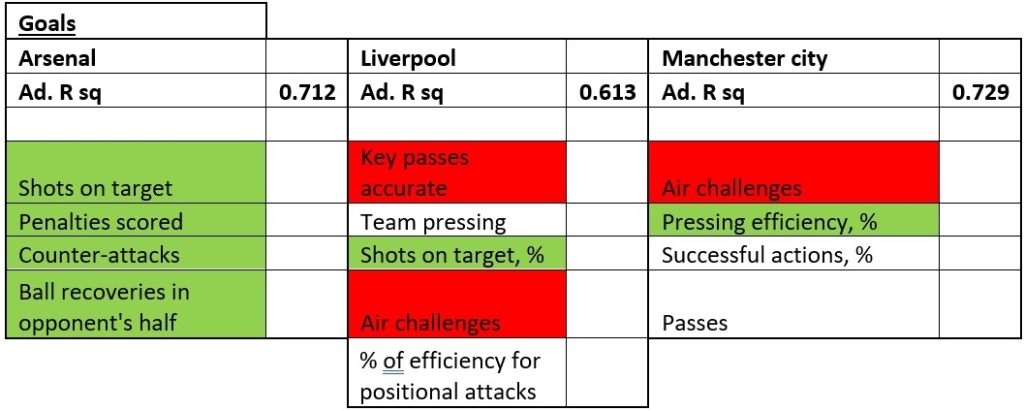
It is interesting to see that in this criteria, Arsenal is also having more “distance” from the other two clubs. While Arsenal is scoring from a more “defensive” position using ball recoveries in the opponent’s half and counter-attacks in Liverpool and Manchester City there is no such case. Both Liverpool and Manchester City are more “pressing oriented” and focused on the “ground”, avoiding the ball in the air.
Regression models for “not defeat”
Not to be defeated is the most difficult to predict of all four observed variables and it is especially radical in Liverpool’s case. Adjusted R square is very weak, just above 0,100. Models for “not defeat” have the least variables per model and again, especially for Liverpool. There is no single variable present in all models.
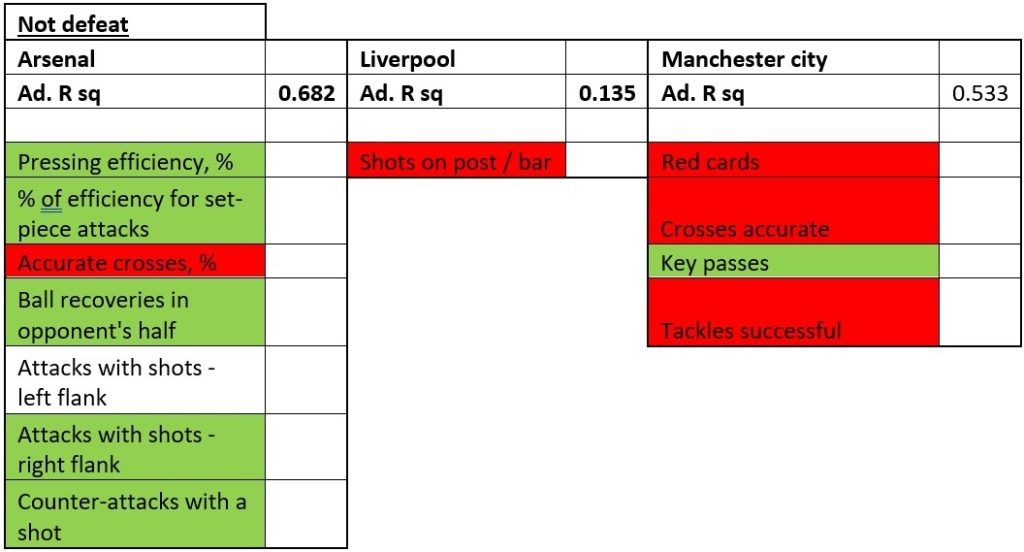
For Arsenal model consists of similar variables while the situation is changed in Liverpool and Manchester City case. In Liverpool’s case, there is just one variable, shots on post/bar which should be reduced. It might indicate that in a number of matches which they have lost, they had shot in post/bar. There was no single other variable which was significant for the model for not losing the match. Manchester City is very sensitive on red cards (the other two clubs are not), tackles and crosses and Manchester should reduce those variables in the game.
Regression models for victory
Although all of the models have their purpose in planning the game, and it might be that is best to observe them all in planning, victory might be the most interesting because victory brings the most to the team, players, coach, and the club. Adjusted R square is between moderate and strong, from 0,598 to 0,673. There is no single variable which is present in all models
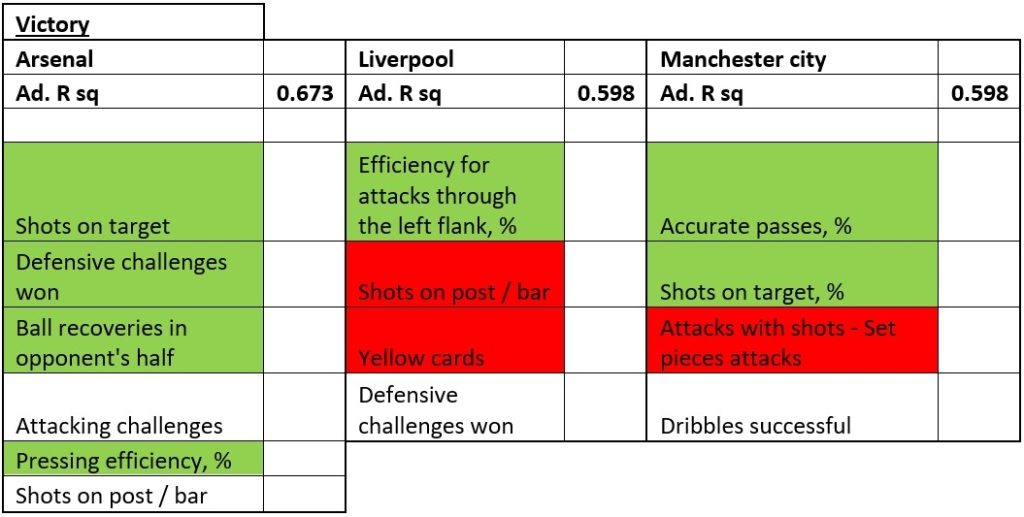
There is a difference between the model in this criterion and another in the Arsenal case. In all other criteria, counterattacks were part of the model, while the “victory” model is not. On the other hand, there are two new variables in the model, per cent of pressing efficiency and defensive challenges won. It might be argued that when Arsenal has successful pressing and defensive challenges won that it indicates a victory for them. In Liverpool’s case, per cent of efficiency of attacks through the left flank is very important. On the other hand, if they are “forced” on yellow cards it indicates not winning the match. Obviously, a lot of shots on post/bar. And while the defence won the challenges, chances for victory are better. In Manchester City’s case, if they succeed in not being “interrupted” you might lose the match against them. If they succeed to dribble their way in and have efficiency in shooting the target be aware.