News News
  • ABOUT
  • SERVICES
  • BLOGS
  • PEOPLE & WORKS
  • LEADERS
  • CONTACT
  • ABOUT
  • SERVICES
  • BLOGS
  • PEOPLE & WORKS
  • LEADERS
  • CONTACT

News

Our Latest News

TOP 100 European football clubs by enterprise value

Football is more than just a sport – it’s a massive business. The latest analysis of the Top 100 European football clubs by enterprise value (2021-2024) reveals fascinating trends and shifts at the top of the financial rankings. While the English Premier League (EPL) continues its dominance, clubs like Nottingham Forest and RC Lens have seen extraordinary growth. However, not all clubs are on an upward trajectory – Schalke 04 and Borussia Dortmund face financial challenges.

Biggest Winners: Who Has Grown the Most?

Manchester City has claimed the top spot with an astonishing €5.94 billion enterprise value, driven by smart investments, global branding, and consistent sporting success. Arsenal FC recorded a 154.8% increase, making it one of the fastest-growing clubs in the top 10. Nottingham Forest saw a 419% revenue increase after being promoted to the Premier League, highlighting the power of TV rights and sponsorship deals.

League Dominance – EPL vs. The Rest of Europe

The English Premier League continues to grow and now generates over €7 billion annually, almost twice as much as La Liga. Their commercial model, combined with global popularity, makes them the financial powerhouse of football.

New Entrants & Club Strategies

Besides financial power, innovative strategies are shaping the football business:

  • Brighton & Hove Albion and Brentford FC use data analytics and a “Moneyball” approach to maximize squad value.
  • RC Lens and Cádiz CF invest in technology and digital strategies to enhance fan engagement.

Conclusion

In modern football, financial strength often translates into success on the pitch. Clubs that effectively balance investments, strategy, and global influence are emerging as long-term leaders.

TOP 100 European football clubs by enterprise valueDownload
Read More
Hamstring injuries in professional football: Summary of research that tracked causes through 21 seasons.

A research paper titled “Hamstring injuries in professional men’s football: a 21-season review” by Ekstrand et al. The paper investigates the incidence, burden, and characteristics of hamstring injuries in professional men’s football over a 21-season period from 2001/2002 to 2021/2022. The study aims to provide updated information on the trends and patterns of football hamstring injuries and identify potential risk factors and prevention strategies for these injuries. The research team collected exposure and injury data from professional football clubs across Europe and analyzed the data to determine the incidence, burden, and characteristics of hamstring injuries. The study used the Munich muscle injury classification system to classify hamstring injuries as either structural or functional and to describe the affected muscles. The research paper provides valuable information to coaches, medical staff, and football organizations to help prevent and manage hamstring injuries in professional men’s football.

What are the main risk factors for hamstring injuries in professional football players?

According to this research the main risk factors for hamstring injuries in professional football players include the intensity and volume of high-risk activities such as running and sprinting, which have increased over time. The crowded player calendar, with more international team travel and matches, also compounds the pressure on hamstrings associated with football intensity. Additionally, previous hamstring injury is a strong predictor of future injury.

How can coaches and medical staff prevent and manage hamstring injuries in their teams?

Autors recommends that coaches and medical staff discuss the risk of hamstring injuries with players and implement appropriate programs to prevent and manage them. These programs may include load management in training and matches, making all parties aware of the risk, and ensuring players complete their rehabilitation diligently.

Which was the mechanism of the injury in percentages?

According to the information provided in the paper the most common mechanism of hamstring injury in professional men’s football was running/sprinting, accounting for 62% of structural injuries and 51% of functional injuries. Other mechanisms of injury included kicking, jumping, and stretching. The frequency of injury mechanisms differed significantly between structural and functional injuries (p<0.001).

Conclusion

Based on the information provided in the paper it can be concluded that hamstring injuries are a significant problem in professional men’s football, with increasing incidence and burden over the past 21 seasons. The main risk factors for hamstring injuries include the intensity and volume of high-risk activities such as running and sprinting, which have increased over time, and previous hamstring injuries. Coaches and medical staff can implement appropriate programs to prevent and manage hamstring injuries, but there is currently no evidence-based program to prevent hamstring recurrence.

Reference:
https://pubmed.ncbi.nlm.nih.gov/36588400/#:~:text=Between%202014/15%20and%202021,CI%201.2%25%20to%2018.3%25

Read More
Example of scouting report
Kyogo-4Download
Read More
AnaLysis of City, Arsenal and Liverpool

1. Manchester City

 Manchester City is a team which bases its game on a set defence and many passes before the end of the action. Over the years, their coach Pep Guardiola has created a game structure in attack whose primary focus is the prevention of the opponent’s counterattacks. With this objective, the role of full back players, often playing in half spaces at different heights and who are complemented by attacking midfielders in the occupation of these spaces, is crucial.In general, City have somewhat passive movements of the full backs in the half spaces after leading the ball to the stopper, and sometimes in situations when the ball is in front of them, most often with a winger.Also, the movements of the full back players in the wing position on the open ball from the central zones can be much more active, where the side players very cautiously conquer the field in depth and thus prevent progressive passes that throw out many opposing players. Such problems are especially visible when stoppers (Stones and Ake) play in the position of the full backs. Such attacks, when they end with a loose ball, open larger spaces between the back and midfield lines because the wing players stand too deep, thus opening spaces between the lines for a second or two before they can close them. It is especially important to emphasize that these problems are much smaller when City uses the overload tactic (positioning more players on one side of the field) because they very well set the opponent players on desired position and then use quick side changes, which to a good extent cancels the above problems.As their game is based on controlling the game with the ball, the role of the last passes in the prevention of the opponent’s counterattacks is important. Many final City passes end up with balls in the air – usually parabolic balls from half space with good control of the zone under the ball with five players, most often in a 2-3 structure. Passes in the air make it difficult for the opponent to open counters because they are much more difficult to control and play accurately.As City narrows the field in attacking the opponent’s goal, they have many shots that end up in the opponent’s block, and therefore the matches in which they use the width of the field better and get more open shots are a good indicator of their victories.Another important factor in choosing to play the opponent’s system is the choice of passing and moving into the middle or wing zone. City occupies the central zones better and overloads them, than it does in the wing zones. Their system is primed to control the middle of the pitch and if they are allowed any space in the central zone they will use it very well, which cannot be said for all situations on the wing.The most effective actions in the wing positions are the dribbles towards the centre of the field by the wing players, to which they have very good movements of the players in front of the ball (further wing, 8 and striker). They do most of the dribbling in the back third with wings and 8s, especially in second attacks (after winning loose or nobody’s ball). The entire structure of the game is designed to prevent and allow frontline players to overwork, so it’s no surprise that dribbling percentage is such a good predictor of their success.City is a team that plays pressing for a large part of the game and tries to take the ball away from the opponent in the shortest possible interval. The biggest problems they have are due to the large number of pressing actions on the opponent’s goalkeeper, where they lose their compactness and because of this, often the second ball after the opponent’s long ball. In this way, the opponent enters the final third and creates opportunities and breaks – usually corners.In general, they are too vertical in pressing and it would be good for them to wait a little longer for pressing triggers (the moment when they can direct the opponent’s attack), because the lines below could close the spaces more compactly.They have the biggest problems with long balls and overloading of the back line. The back line tries to defend such attacks with a high line and only a small mistake in closing is enough to open a deep pass for the opponent. They react especially poorly to the overload in the middle of the field in the jump, where their side players remain isolated in the game 1vs1.Another potential disadvantage is the control of long balls, which they try to keep in their possession in a risky way (passing and dribbling) and in this way they provide opportunities for the opponents.The same problem is also reflected in breaks, and the most problems are created by teams that attack all free kicks within 60 m from their goal with many players. The constant attempts to keep the back line high and the weaker pressing reset after the second ball leaves them exposed against this type of action.

2. Liverpool

 Liverpool is a team that bases its game much more on the control of transitions, long balls, and other balls.In their attack, the emphasis is on parabolic deep balls behind the back line, crosses from wing positions and half space, quick short combinations in central zones and diagonal balls.They especially use diagonal balls towards the left side to Roberston, for whom the winger opens space in the wing position with his deep movements, and there is almost no game in which they are offensively efficient, without that segment of the game functioning at a high level.Their attacking structure is still not as clean as City’s. They rely more on the dynamics of actions and excellent counter pressing.The largest number of players are brought into the 16m when the opponent allows them depth to the side players, and then the occupation of the 16m follows with four to five players while the players below control the bounced balls very well after the centre kick.Liverpool creates the most successful attacks after the first and second lost ball, by trying to play the final pass in the inferiority of two to three players. When it seems that the lines below will not compactly accompany such an attack, there is a strong movement towards the ball and a counter-pressing that seeks to take the ball through the duel, cutting the passing lines and taking advantage of the direction of the opponent’s attacks. Since their game is based so much on that segment, the number of won defensive duels is crucial in this phase of the game as well.Transitions work in the same way, where they like to play deep on two or three players in the front line and if the deep ball does not go through, they have an excellent movement of the formation in front of the ball, which provides them with the possibility of counter pressing.It is interesting that they use the same principle with their own and the opponent’s long balls.The only situations when they are not so vertical is when there is an open diagonal ball towards the far side, where they create an excellent surplus in front of the ball with the side players and attack the opponent’s penalty area beautifully in waves.Due to the aforementioned style of play, it is clear that aggressive control of the lost ball plays a key role for them in all phases of the game, and because of this, yellow cards are a good predictor of their results = when the prevention structure moves well under the ball, they win duels and take balls cleanly, and when they are late they fall out and receive an increased number of yellow cards.It should be emphasized that in pressing and counter-pressing actions, they have a great focus on moving towards the ball, and when the situation is played out, they compensate with extremely good descent and defence of the penalty area. The back pressing of the attacking and midfield lines after they have been played is perhaps the best in the world and it is very difficult to play back passes against them when the opposing team enters the final third.

3. Arsenal

 When we analyse Arsenal, we must divide the 2021/22 season into two parts. The first part of the season was very bad, and they were looking for a style of play that suits them. In the first 10 rounds, they were so bad that they were close to the relegation zone.From the 4-2-3-1 system, the team usually had a very weak occupation of the central zones, a lack of width due to premature entry of the wings towards the middle, very high positioned full backs who opened spaces for the counter and risky combinations in the central zones.In the defensive phase, the team had weak pressure on the ball, poorly controlled the far side and especially poorly defended the half spaces because of the back line that passively guarded the goal and because of which the wings and the near midfielders closed those spaces in an undefined and bad way.Because of all the above-mentioned characteristics and transitions, they were disconnected and isolated, and everything pointed to the dismissal of coach Arteta.From the period around the New Year, they found the game in a 4-3-3 formation and since then they have been at the very top of the league in terms of points won. They started playing with the full backs set up in half space, false nine and high 8s as the general setting of the game. The game began to resemble that of City where Arteta worked as an assistant coach before taking over at Arsenal.The main difference is that in attack Arsenal is more focused on playing the wing zones with triangles on the sides that form a side-8 and the wing, and more attack turns through the near midfielder. On both wings, they have wings on opposite feet and in the new system of the game they can reach the wings much more easily, who dribble towards the middle and create excess and play diagonal passing lines in front of them.The moment they started playing that way, they started to control the middle of the field and win many balls from counter pressing. From that moment on, the number of defensive duels won, became a great predictor of their success.A segment that has also taken them to a whole new level is moving towards long balls. Before, they played long balls against the settled defence and counters against isolated players of the offensive line, while now they even anticipate the zones of the second ball with players under the ball, which significantly increased the number of offensive duels won.They use many crosses from half space after the return ball, so that both, they, and City lack width in the attacking phase, which is why they have an increased number of blocked shots because they shoot at the goal in situations when the opponent is compact in width in front of their goal.They have taken the pressing game to a completely new level, they manage to initiate pressing with strikers, wingers and 8s across different widths of the pitch, which was never the case before. In this way, they significantly increased the number of balls won in the opponent’s half, along with, of course, the counter-pressing phase, which we explained in the previous part of the text. On the other hand, they showed problems in pressing actions against teams that play with five players in the back line, where they either opened too much space in the intermediate lines or became too passive and focused on compactly defending their goal without pressing the ball.As their game became more connected, their counters became much better and there they introduced a segment that Liverpool has, which is the arrival of the full backs from the second plan with overlapping and underlapping, but in addition they added the arrival of 8 in the central areas of the field in the end.However, when they have less time on the ball per won ball, they still know how to play too vertically and do not use the third man enough to play off the opponent’s pressure towards the far side.The phase of the game that they brought to an exceptional level is the attacking throw in, where they developed excellent actions to open up the far side and created a large number of entries into the final third in that way.

Read More
Difference between Arsenal, Liverpool and Manchester city on the pitch in the 2021/2022 season through the statistics.

Difference between Arsenal, Liverpool and Manchester city on the pitch in the 2021/2022 season through the statistics.

After analysing nine leagues in Europe (TOP5+Austria, Belgium, Croatia, and Poland) (https://www.linkedin.com/pulse/do-leagues-generally-differ-between-themselves-pitch-slaven-marasovi%C4%87) based on a survey conducted on LinkedIn I have analysed three clubs from Premier League in the season 2021/22: Manchester City, Liverpool and Arsenal. So, how do these three clubs differ on the pitch based on the statistical data and analysis? Could you read the playing style from it? Their strength and weaknesses. What could be the benefits of this kind of analysis? Could clubs use it to improve their strengths and reduce their liabilities or to recognize it in opponents’ games? Could players use it for identifying the best clubs for their signings? Maybe it could be interesting for journalists to analyse matches…?

To answer those questions, I have used four criteriums:

1. What are the key factors to create a chance in the individual club?

2. What are the key factors on the pitch for scoring a goal in the individual club?

3. What are the key factors on the pitch for not losing the game in the individual club?

4. What are the key factors on the pitch for winning a match in an individual club?

To describe those four criteriums I have used:

1.     frequency (what is most used in each league),

2.     statistical correlation and

3.     statistical regression.

As we stated in the prior article, the frequency of 104 observed aspects of the game will tell us which aspect of the match is happening the most. That will not help us understand how to reach each of the criteriums.

On the opposite, the statistical correlation will tell us what correlates with each of the criteriums and help us start understanding each of criteriums per country. So, more interesting will be those aspects of the game which have a stronger correlation with each of the criterium.

Regression models will indicate us what is specific for reaching each of criteriums per each country and help us better understand each of criteriums. For the best understanding of each country will be summarized correlations and regression models as prepared for interpretation.

If you want to read more about regression models just go on the above-mentioned article https://www.linkedin.com/pulse/do-leagues-generally-differ-between-themselves-pitch-slaven-marasovi%C4%87 .

I will provide you insights and interpretation will live for you. Also, I can announce the interpretation of this data by an expert @Goran Rosanda, so, stay tuned.

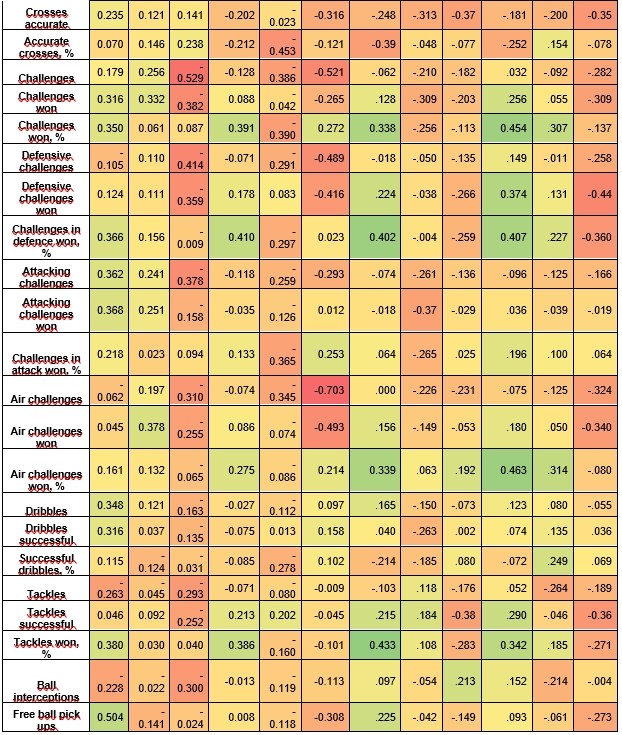
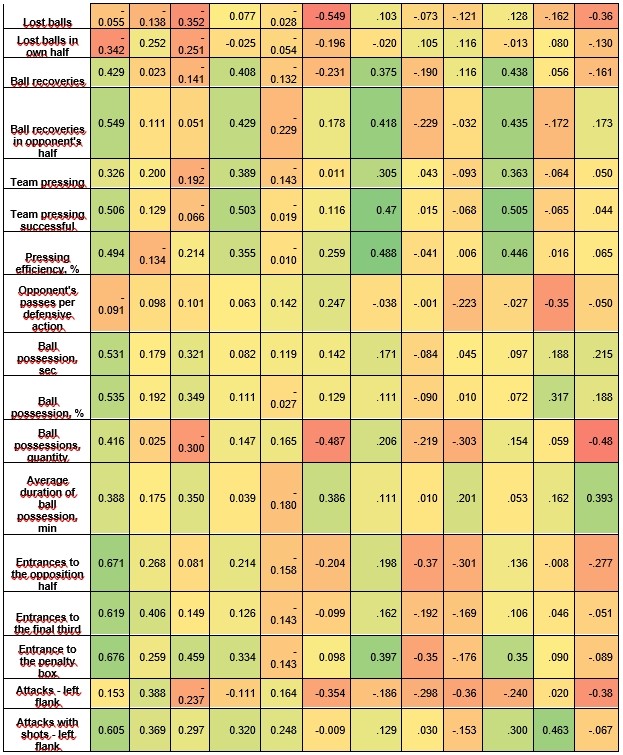
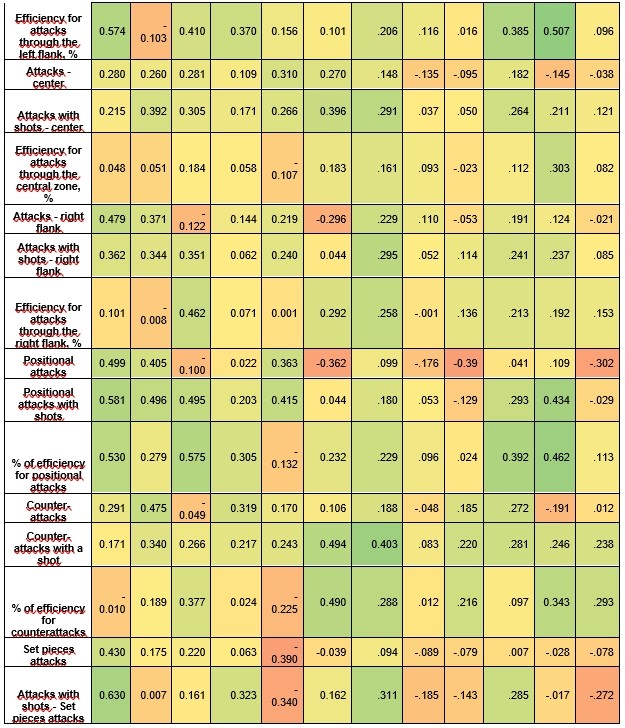
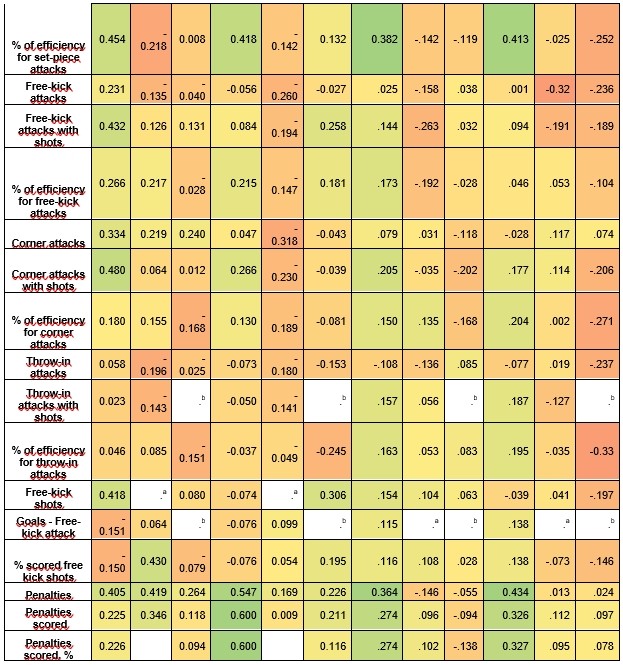
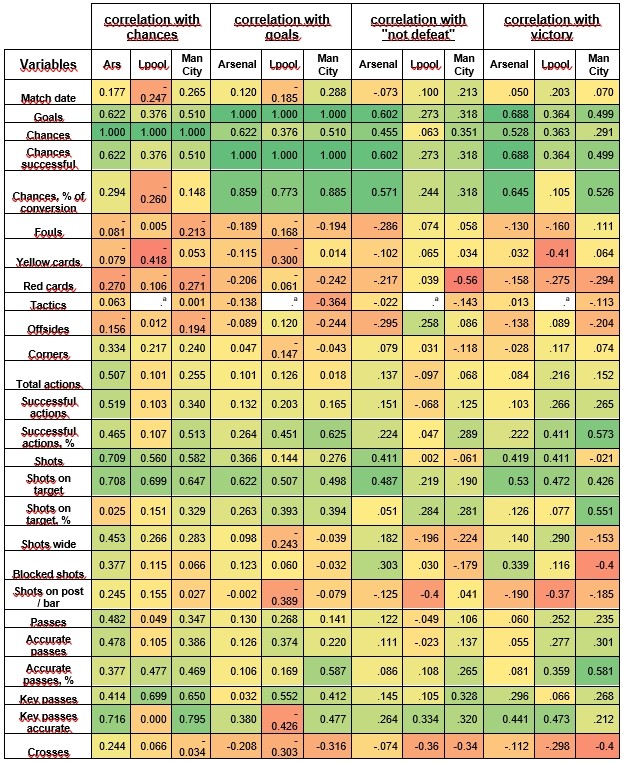
In the following heatmap of correlations of different aspects of the game are presented. So, let’s start with correlations between “creating a chance”, “scoring a goal”, “not losing a match” and “winning a match” and different aspects of the game per each club. It was very interesting to go through each correlation and notice the differences, so I advise you, if you find this topic interesting, to go through it. That’s why I will provide all correlations to you (without xG related). Each aspect of the game is interesting and if you combined one aspect of the game with another you can have interesting conclusions. For the practical side and size of this text, I will focus just on the obvious differences in the game between the clubs.

The yellow card’s most negative influence on the Liverpool game and correlation is much (negative) higher than for the other two clubs, while the red card’s most negative influence has on the Manchester City game. Manchester City is having the most negative correlation with offsides (have a look at Liverpool in the “not defeat” category”). The percentage of successful actions is most important for Manchester City, while the number of shots and shots on target is for Arsenal. Again, per cent of shots on target is having the most positive influence on Manchester City’s game. Further on, blocked shots have a negative influence on the Manchester City game. There is an interesting difference between Liverpool and the other two clubs relating to key passes accurate. While Arsenal and Manchester City have an extremely high positive correlation with creating chance (+0.7), Liverpool does not have any correlation at all (0.0). For goals, Manchester City and Arsenal are having very positive correlation (0.4) while Liverpool is having very negative (-0.4). In “not losing the game” and “winning the match” Liverpool is having most positive correlation.

Per cent of accurate passes is most important for Manchester City games, and crosses, challenges and challenges won are having the most negative influence on the same club. On the other side per cent of the challenges won is having a positive influence on Arsenal’s game. Also, defensive challenges and defensive challenges won are having a mostly negative influence on Manchester City games. This does not mean that winning challenges in defence is bad but keeping Manchester City defending and under-pressing is negatively influencing their performance. It is not easy to do, obviously, but that’s the description of how they have been not winning and losing games.

Manchester City also does not like football “in the air” since they are having very different correlation in air challenges and air challenges won than Arsenal and Liverpool. In Manchester City, it is very negative. On the other side, Arsenal is having a positive influence in winning air challenges with victory and not losing the match. Successful tackles are having the most negative influence on the Manchester City game again as same as lost balls. Ball recoveries are having a most positive influence on Arsenal’s game, same as ball recoveries in the opponent’s half, team pressing, team pressing successfully and per cent of pressing efficiency. Ball possession quantity is having the most negative influence on the Manchester City game while the average duration of ball possession is having the most positive influence on the Manchester City game. This might indicate that in games in which Manchester City had a lot of possession whit small average possession of the ball possession and with a lot of interruption in actions from the opposite team. Attacks on the left flank are most negative for Manchester City and most positive for Liverpool. The positional attack is the most negative for the Manchester City game the same as per cent of efficiency of throw-in actions. Liverpool “does not like” free kicks with shots because it has a negative influence on their game. Penalties have a positive influence on Arsenal’s game.

Table 1.: Heatmap of correlations between chances and different aspects of game per each club

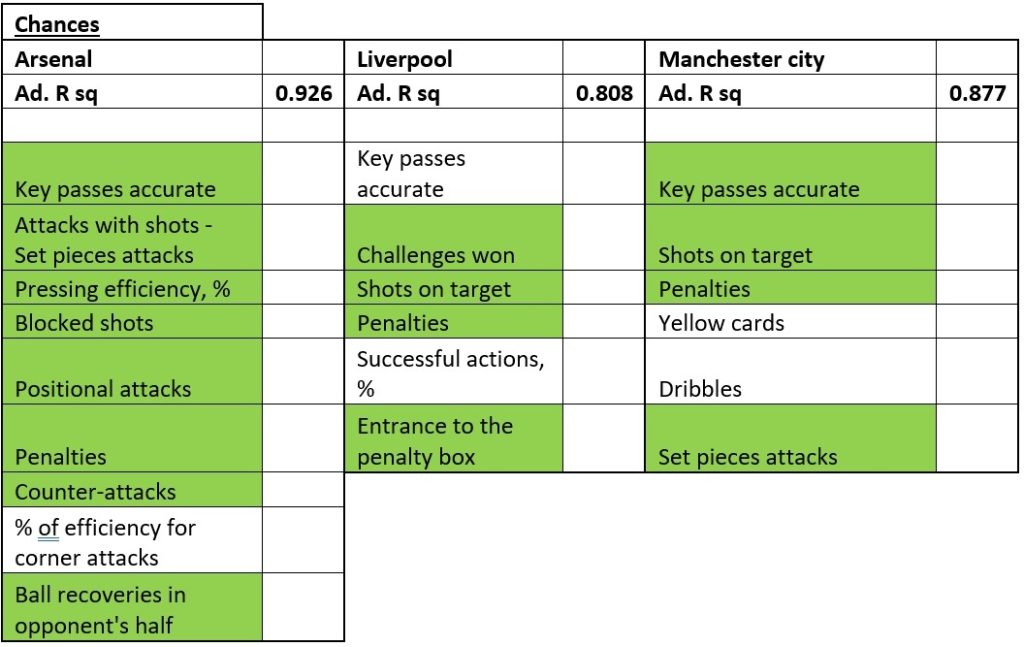
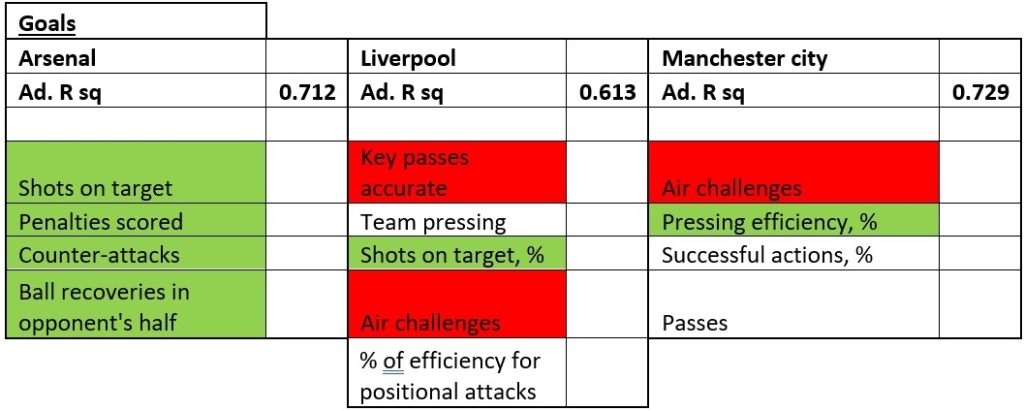
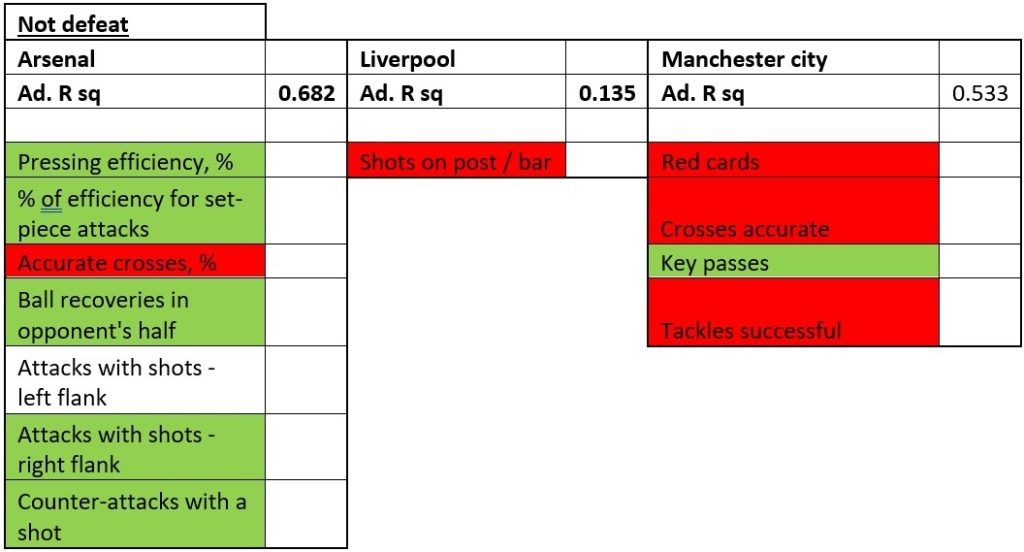
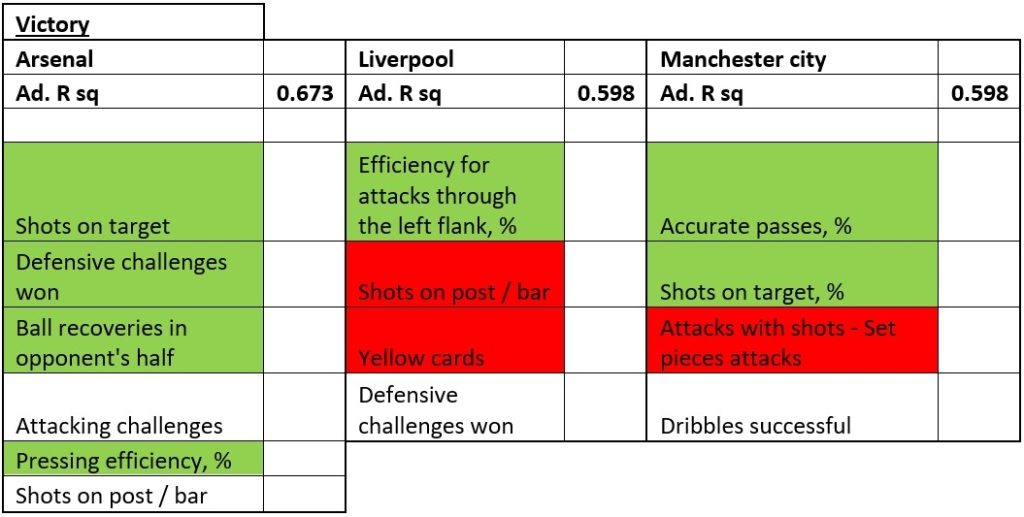
The following models will indicate to us what is specific for reaching each of the criteriums and for each club. In each of the tables for regression models, green will be marked aspects of the game which have a statistically positive significant correlation, red will be marked aspects of the game which have a statistically negative significant correlation and those aspects of the game which don’t have any statistically significant correlation will not be marked.

It is interesting that some clubs’ models have fewer independent variables and in some more. It might be that in clubs with fewer variables, independent variables are more influential on dependent variables than in models with more independent variables in the model. It means that experts would have fewer variables to focus on if they would use this model to improve chances, and goals, not being defeated or winning. Also seeing variables in chances, one can see what each club is focused on. It might be interesting for planning matches or for opponent teams playing games against such clubs. 

Regression models for “create a chance”

Adjusted R square is very strong (very high) for the “create chance” criterium, for all clubs. It goes from 0,808 for Liverpool, over 0.877 for Manchester City till 0.926 for Arsenal. Only key passes – accurate and penalties are present in all models. 

For creating chances for Arsenal, it is important to have efficient pressing, ball recoveries in the opponent’s half, counter attacks among others. Arsenal has attacks with shots – set pieces attacks while Liverpool has entrance to the penalty box with shots on target and Manchester City has set pieces attacks, dribbles, key passes accurate and shots on target. It might be observed from the perspective of distance from goal and from the perspective of how they “materialize” chances. It seems that Liverpool and Manchester City are more similar than Arsenal is with these two clubs. It could be argued that the difference between Liverpool and Manchester City is by “principle” how they “approach” the chance. It might be that Liverpool is reaching the penalty box by actions before the shot while Manchester City also use dribbles before chance not just from the penalty box.

Regression models for “score a goal”

To score a goal is more difficult to predict than to make a chance. Still, the adjusted R square is strong above 0,600. On the other side, in models for “goals” is much more variables with a negative significant Pearson correlation. Have in mind to see those variables as those which should be reduced in the potential game plan. There is no single variable which is common for all clubs. 

It is interesting to see that in this criteria, Arsenal is also having more “distance” from the other two clubs. While Arsenal is scoring from a more “defensive” position using ball recoveries in the opponent’s half and counter-attacks in Liverpool and Manchester City there is no such case. Both Liverpool and Manchester City are more “pressing oriented” and focused on the “ground”, avoiding the ball in the air.

Regression models for “not defeat”

Not to be defeated is the most difficult to predict of all four observed variables and it is especially radical in Liverpool’s case. Adjusted R square is very weak, just above 0,100. Models for “not defeat” have the least variables per model and again, especially for Liverpool. There is no single variable present in all models.

For Arsenal model consists of similar variables while the situation is changed in Liverpool and Manchester City case. In Liverpool’s case, there is just one variable, shots on post/bar which should be reduced. It might indicate that in a number of matches which they have lost, they had shot in post/bar. There was no single other variable which was significant for the model for not losing the match. Manchester City is very sensitive on red cards (the other two clubs are not), tackles and crosses and Manchester should reduce those variables in the game.

Regression models for victory

Although all of the models have their purpose in planning the game, and it might be that is best to observe them all in planning, victory might be the most interesting because victory brings the most to the team, players, coach, and the club. Adjusted R square is between moderate and strong, from 0,598 to 0,673. There is no single variable which is present in all models

There is a difference between the model in this criterion and another in the Arsenal case. In all other criteria, counterattacks were part of the model, while the “victory” model is not. On the other hand, there are two new variables in the model, per cent of pressing efficiency and defensive challenges won. It might be argued that when Arsenal has successful pressing and defensive challenges won that it indicates a victory for them. In Liverpool’s case, per cent of efficiency of attacks through the left flank is very important. On the other hand, if they are “forced” on yellow cards it indicates not winning the match. Obviously, a lot of shots on post/bar. And while the defence won the challenges, chances for victory are better. In Manchester City’s case, if they succeed in not being “interrupted” you might lose the match against them. If they succeed to dribble their way in and have efficiency in shooting the target be aware.

Read More
Compared to the last, what changed in Arsenal, Manchester City and Liverpool this season?

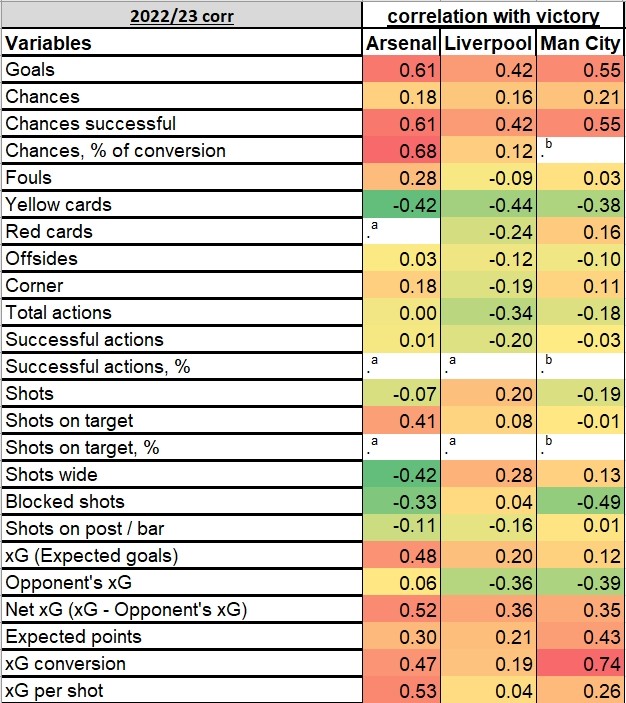
This analysis was made on the first 17 rounds of the Premier league. Besides this season, the highest changes are identified and presented. Also, the biggest changes which have significant statistical correlation this season is also given. Analysis was made based on the criterium “victory”. It means that all presented data all in relation to victory. If it is positive, it means that when the frequency is higher, victory is more likely to happen (e.g., more shots more possibility for victory), and vice versa (e.g., more lost balls, less possibility for victory). It is interesting to notice that there are not just minor differences in correlations between clubs. Also, it is very indicative to see where the highest changes in correlation with victory happened this season compared to last.

Statistical correlation goes from -1 to +1. -1 means that if something happens, the other variable definitely will not happen, while +1 implies that if something happens, the other analysed variable will definitely happen.

Correlation in season 2022/23

Arsenal’s „shots on target“ have a moderate correlation with victory in opposition to two others clubs which means that they are more precise or have better-prepared situations for shooting on goal or better decision–making in execution. On the other side shots wide have a negative correlation with victory for Arsenal while Liverpool has an almost moderate positive correlation. It might mean that Liverpool achieves victory through the high intensity of attacks; on a higher amount of attacks with shots comes a higher amount of victories. On the other side, very moderate, near-strong negative correlation Manchester City has with blocked shots. Liverpool doesn’t have it negatively at all, but Arsenal does have it, almost weaker than Manchester City.

here is an indicative difference between Arsenal on one side and Liverpool and Manchester City on the other side in crosses. Arsenal has a weak but positive correlation while Arsenal and Manchester City have between weak and moderate and negative correlation.

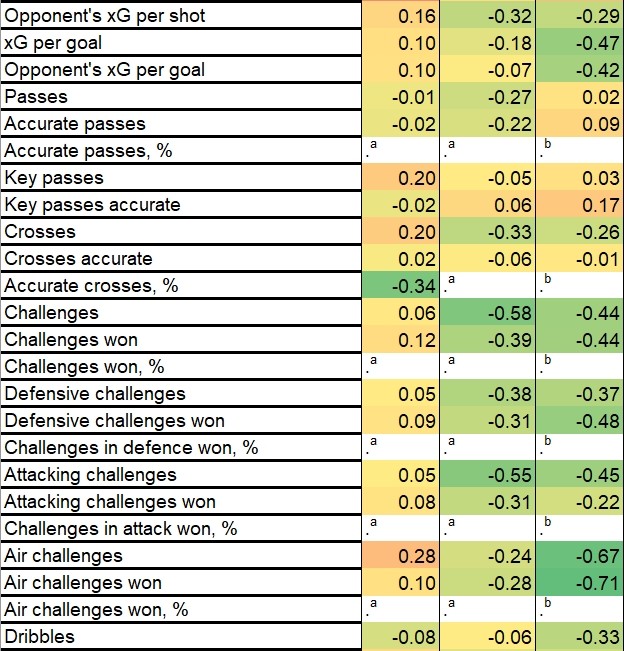
In all types of challenges, Arsenal has no stronger significant correlation with victory, but Manchester City and Liverpool do. It means that challenges do not influence the victory of Arsenal but do influence negatively the victories of Manchester City and Liverpool. This is very important in understanding the game styles of those three clubs. It is especially noticeable in air challenges where Arsenal has a weak to moderate positive correlation with the victory while Liverpool and especially Manchester City, have a very strong negative correlation.

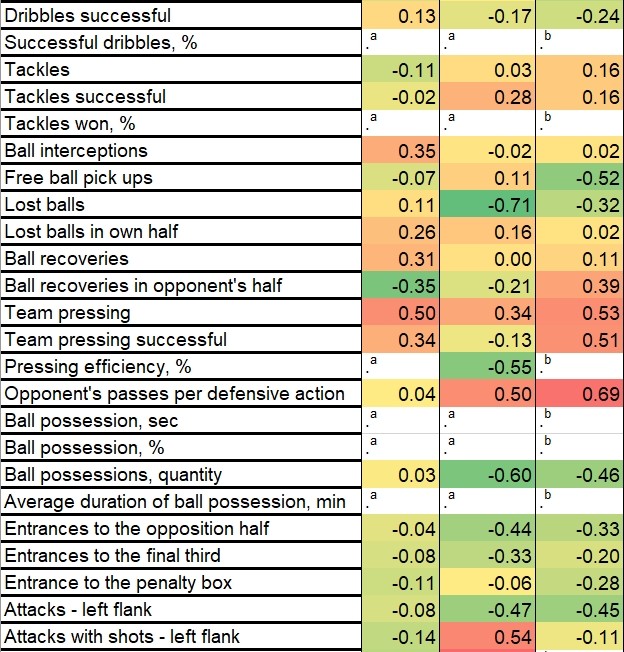
Ball recoveries and ball interceptions have a positive weak correlation with victory in Arsenal’s case but don’t have for others.

Liverpool has a strong – very strong negative correlation between lost balls and victory. Manchester City has weak negative and Arsenal doesn’t have a significant correlation at all between lost balls and victory. Obviously, Arsenal had a better response on lost balls in the first 17 rounds, while Liverpool has the worst and even generally poor reaction on lost balls when we are analysing the influence on victory.

An interesting difference between Arsenal and Manchester City is that Arsenal has a weak – moderate negative correlation with ball recoveries in the opponent’s half while Manchester City has a moderate positive correlation with victory. So, for Manchester City is, generally, very important to play on the opposite side of the field while Arsenal does not respond positively in such a situation.

All teams have a similar moderate positive correlation between team pressing and victory, with Manchester City having the strongest and Liverpool the weakest.

One more interesting difference between Arsenal and the other two teams is in the opponent’s passes per defensive action. Arsenal doesn’t have a significant correlation while Manchester City and Liverpool do have a moderate – strong positive correlation. It means they actually do more opponent’s passes per defensive action while for Arsenal is irrelevant. Manchester City prefers the right flank while Arsenal is balanced with a little more flavour on both flanks than in the centre.

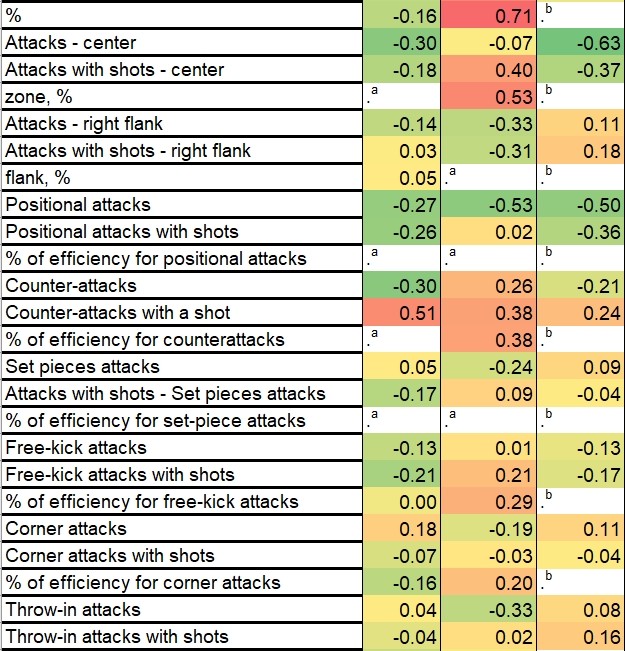
Liverpool does like the left flank in case they succeed to have a shot in such an action. If not, it might be dangerous for them. Also, they like attacks through the centre.

Neither of the clubs has a positive significant influence on positional attacks with victory. Obviously, they need to use some other mechanisms to win a match. Even more, all clubs have a significant negative correlation with victory, Arsenal is weak, and Manchester City and Liverpool strong negative correlation between positional attacks and victory.

All teams, if they succeed to shoot have a positive significant correlation between counterattacks with victory in which Arsenal have a moderate correlation, the best of all three teams, while Liverpool and finally Manchester City, have a weak positive correlation.

Liverpool like free-kick attacks with shots but doesn’t like throw-ins. For the other two teams, there is no significant correlation.

It seems that there is a positive, weak, but significant correlation between penalties and victories in the Manchester City case.

The biggest difference in correlation from season 2021/22 to 2022/23 with victory

In this paragraph, I’m analysing which segments of the game made the highest change from last season. It is measured in statistical correlation with victory.

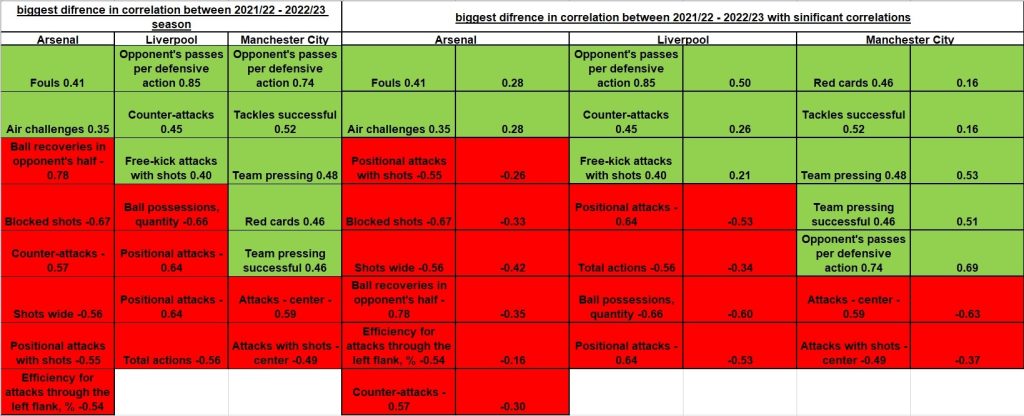
Arsenal made the highest increase in significant correlation with victory in fouls (an increase of 0.41) and air challenges (an increase of 0.35). On the other side highest decrease in significant correlation Arsenal made with: ball recoveries in the opponent’s half (-0.78), blocked shots (-0.67), counter-attacks (-0.57), shots wide (-0.56), positional attacks with shots (-0.55) and efficiency for attacks through the left flank, % (-0.54). It seems that Arsenal is more capable to create successful actions from “scratch” this season than last and they have more options in the creation of successful actions which might be more direct this season than the last one. It does not mean necessarily that Arsenal has weaker ball recoveries, blocked shots and other above-stated variables, but because of the change in game style, they are using it less.

For Liverpool highest increase was in the opponent’s passes per defensive action (0.85), counter-attacks (0.45) and free-kick attacks with shots (0.40). The highest decrease in correlation with a victory was in: ball possessions, quantity (-0.66), positional attacks (-0.64) and total actions (-0.56). It is obvious that Liverpool is having decreased in the creation of successful actions from “scratch”, but they perform well if the ball is in the opponents’ possession and combined with counter-attacks as well, but it does not bring more victories to them.

Manchester City had the highest increase in correlation with victory in opponent’s passes per defensive action (0.74), tackles successful (0.52), team pressing (0.48), red cards (0.46) and the team pressing successfully (0.46). On the other side highest decrease with a victory was in attacks – centre (-0.59) and attacks with shots – centre (-0.49). It might be that Manchester City has increased intensity in team pressing this year but it might be over-aggressive which results in red cards, tackles and team pressing itself. Also, they have started to use both sides as well as centres for attacks. Or maybe more precisely, they are much more expected from opponents in attacks in the centre while flanks are more open. If Manchester persists in attacks in the centre, its lower chances for victory. Manchester should spread attacks on both sides as well.

Highest statistically significant correlations among the biggest difference in correlation from season 2021/22 to 2022/23 with victory

An increase in Arsenal with fouls and air challenges has a 0.28 strength of positive correlation which is a weak correlation. The strongest negative correlation is with shots wide (-0.42), Ball recoveries in the opponent’s half (-0.35) and blocked shots (-0.33) which are moderate negative correlations. Arsenal obviously has problems if they lose the ball on the opponent’s side and they should stream to finish each action rather than be interrupted in the field which has a negative influence on victory. It might be that the next step in the development of their game will be in reaction to lost balls and preventing counter-attacks.

For Liverpool highest positive correlation among those with the highest change in correlation with victory is with: the opponent’s passes per defensive action (0.50) – strong/moderate, counter-attacks (0.26) and free-kick attacks with shots (0.21) – weak. The strongest negative correlation among those which decreased significantly is with: ball possessions, quantity (-0.60), and positional attacks (-0.53). Liverpool is not using possession of the ball efficiently, and they achieve their victories more through counterattacks and opponents’ instability after losing the ball in the field. There might be more reasons for this including motivation and intensity of the general performance.

In Manchester City’s case strongest positive correlation with victory, among those correlations which increased most is with: Opponent’s passes per defensive action (0.69), team pressing (0.53) and the team pressing successfully (0.51) which are all strong correlations. The highest negative significant correlation among those which decreased most in Manchester is with: attacks – centre (-0.63) – strong and attacks with shots – centre (-0.37) – moderate. Manchester City is very efficiently using team pressing and this segment is something their opponents should be aware of. On the other side, when Manchester is in possession of the ball, this year, opponents are prepared for their actions through the centre and Manchester should change something or move to flanks as well to create more time for their players to use more available space than if they use just centre.

Read More
Do leagues generally differ between themselves on the pitch by different game aspects and how?

Have you ever wondered do leagues between themselves differ between each other based on the overall performance on the pitch? I mean of course they differ, if you have team with 100 times more values than team in another league, but how do they differ? And how would you identify the differences between leagues?

I have tested nine leagues in last season (2020/2021) by different aspects of the game: England, Spain, German, Italy, France, Belgium, Austria, Croatia and Poland. And I have used four criteriums to identify those differences:

1. What are key factors to create a chance in the individual league?

2. What are key factors on the pitch for scoring a goal in the individual league?

3. What are key factors on the pitch for not losing the game in the individual league?

4. What are key factors on the pitch for winning a match in individual league?

To identify those goals, I have used:

  1. frequency (what is most used in each league),
  2. statistical correlation and
  3. statistical regression.

The frequency of 104 observed aspects of the game will tell us which aspect of the match is happening the most. That will not help us understanding how to reach each of criterium.

On the opposite, statistical correlation will tell us what correlate with each of criterium and help us started understanding each of criteriums per country. So, more interesting will be those aspects of the game which have stronger correlation with each of criterium.

Regression models will indicate us what is specific for reaching each of criteriums per each country and help us better understand each of criteriums. For best understanding for each country will be summarized correlations and regression models as preparation for interpretation.

For all observed dependent variables (criteriums) aim was to get the highest possible R number with the same methodology for all observed dependent variables and for all leagues. R number explains the power of the model. It lies between 0 and 1. Higher the number more precise model. It actually explains the number of variations in the dependent variable which are explained with the independent variables. Adjusted R square is R number multiplied with adjustment factor created by comparison different regression models with different independent variables.

All variables in model are statistically significant, and those which are positively statistically significant in Pearson correlation are marked green and those which are negatively statistically significant in Pearson correlation are marked red. Those which are not statistically significant in Pearson correlation are not marked. Mostly VIF number is below 5, almost all bellow 10, and rarely above 10.

Finally, I will leave each of you to give “sweet” interpretation of results. And would like to hear your thoughts about interpretation from your side 😉

In each of following heatmap and highlight map correlation of different aspects of game are presented in tables. So, let’s start with correlations between “creating a chance” and different aspects of game per countries.

Table 1.: Heatmap of correlations between chances and different aspects of game per countries

CHANCESEnglandSpainFranceGermanyItalyAustriaBelgiumCroatiaPoland
Attacks – left flank0.1780.1580.1600.0780.1970.1990.0980.2520.145
Attacks with shots – left flank0.4130.4000.3500.3640.4650.3860.4140.4210.485
Efficiency for attacks through the left flank, %0.3610.3740.2890.3530.4150.3630.3980.3160.456
Attacks – center0.2010.1210.2330.2570.1110.2640.1960.0880.108
Attacks with shots – center0.4380.3430.4230.4220.3830.4890.3800.2400.370
Efficiency for attacks through the central zone, %0.3730.3000.3480.3330.3600.3970.3420.2220.332
Attacks – right flank0.2670.1180.0690.1220.1310.1920.1780.2780.113
Attacks with shots – right flank0.4500.3900.3230.3920.4110.4210.4500.4270.389
Efficiency for attacks through the right flank, %0.3800.3540.3210.3750.3770.4140.3990.3380.386
Positional attacks0.3540.2400.2290.2350.2130.3110.2290.3240.176
Positional attacks with shots0.5790.5470.5120.5470.5320.5580.5680.5050.537
% of efficiency for positional attacks0.5380.5160.4790.5320.5040.5360.5430.4280.527
Counter-attacks0.1220.0320.0850.0990.1690.1880.1790.1590.159
Counter-attacks with a shot0.3750.3070.3190.3420.4200.3840.3710.3320.439
% of efficiency for counterattacks0.3540.3040.3070.3330.3670.3090.3140.2930.401
Set pieces attacks0.2960.1990.3290.1540.3170.2470.2090.4080.258
Attacks with shots – Set pieces attacks0.4290.3270.3810.3840.4480.3930.3590.4960.397
% of efficiency for set-piece attacks0.2920.2610.1670.3170.2930.2870.2530.2820.280
Free-kick attacks-0.022-0.0540.073-0.0360.032-0.039-0.0080.1290.010
Free-kick attacks with shots0.1700.1110.1700.1700.2030.1470.1370.2310.182
% of efficiency for free-kick attacks0.1920.1660.1480.2140.2010.1550.1510.1870.232
Corner attacks0.4200.3380.3390.3590.4200.4040.3590.4590.368
Corner attacks with shots0.4110.3190.3190.3630.4190.3720.3580.4490.364
% of efficiency for corner attacks0.1620.1410.1070.1510.2080.1580.1650.2180.149
Throw-in attacks-0.058-0.0630.070-0.172-0.068-0.001-0.0910.054-0.076
Throw-in attacks with shots-0.0180.0020.023-0.058-0.0190.054-0.0030.079-0.025
% of efficiency for throw-in attacks0.003-0.019-0.007-0.029-0.0370.0630.0200.039-0.026
Free-kick shots0.1680.0780.1660.0700.1790.2130.0570.1020.170
Goals – Free-kick attack0.0560.0370.1150.1180.0800.1260.0600.0820.023
% scored free kick shots0.0320.0420.1110.1100.0710.0760.0590.0530.028

If we highlight corelations stronger than +/- 0,400 than we have different table:

Table 2.: Highlight of correlations stronger than +/- 0,400 between chances and different aspects of game per countries

CHANCESEnglandSpainFranceGermanyItalyAustriaBelgiumCroatiaPoland
Attacks with shots – left flank0.4130.4000.3500.3640.4650.3860.4140.4210.485
Efficiency for attacks through the left flank, %0.3610.3740.2890.3530.4150.3630.3980.3160.456
Attacks with shots – center0.4380.3430.4230.4220.3830.4890.3800.2400.370
Attacks with shots – right flank0.4500.3900.3230.3920.4110.4210.4500.4270.389
Efficiency for attacks through the right flank, %0.3800.3540.3210.3750.3770.4140.3990.3380.386
Positional attacks with shots0.5790.5470.5120.5470.5320.5580.5680.5050.537
% of efficiency for positional attacks0.5380.5160.4790.5320.5040.5360.5430.4280.527
Counter-attacks with a shot0.3750.3070.3190.3420.4200.3840.3710.3320.439
% of efficiency for counterattacks0.3540.3040.3070.3330.3670.3090.3140.2930.401
Set pieces attacks0.2960.1990.3290.1540.3170.2470.2090.4080.258
Attacks with shots – Set pieces attacks0.4290.3270.3810.3840.4480.3930.3590.4960.397
Corner attacks0.4200.3380.3390.3590.4200.4040.3590.4590.368
Corner attacks with shots0.4110.3190.3190.3630.4190.3720.3580.4490.364

Highest number of correlations stronger than +/- 0,400 have Italy (9), while least France, Germany and Belgium (3). While there are some common correlations between all or most countries, like for “Positional attacks with shots” (no exclusion), “% of efficiency for positional attacks” (no exclusion), “Attacks with shots – left flank” (France, Germany and Austria excluded), “Attacks with shots – centre” (Spain, Italy, Belgium, Croatia and Poland excluded) and “Corner attacks” (Spain, France, Germany Belgium and Poland excluded). On the other side, there are some specifies for single of few countries. “Efficiency for attacks through the left flank, %” is specific for Italy and Poland, “Efficiency for attacks through the right flank, %” is specific just for Austria, “Counter-attacks with a shot” is specific just for Italy and “Set pieces attacks” just for Croatia.

Among all correlations strongest is correlation in England with “Positional attacks with shots” (0,579**).

When we look at correlations between “score a goal” and different aspects of game we have generally weaker correlations.

Table 3.: Heatmap of correlations between goals and different aspects of game per countries

GOALSEnglandSpainFranceGermanyItalyAustriaBelgiumCroatiaPoland
Attacks – left flank0.009-0.006-0.055-0.037-0.0320.023-0.0300.085-0.028
Attacks with shots – left flank0.2380.2010.1260.2090.2400.2340.2410.2150.214
Efficiency for attacks through the left flank, %0.2740.2200.1510.2410.2740.2660.2700.1970.248
Attacks – center0.1850.0250.1110.1410.0620.0650.0390.0510.042
Attacks with shots – center0.3940.2340.2970.2790.2290.2990.1700.1750.226
Efficiency for attacks through the central zone, %0.3220.2220.2580.2330.2240.2970.1800.1680.228
Attacks – right flank0.044-0.093-0.116-0.108-0.0400.030-0.0640.050-0.089
Attacks with shots – right flank0.2380.1740.1480.1580.2300.2540.2260.2200.147
Efficiency for attacks through the right flank, %0.2710.2210.2170.2220.2630.2770.2680.2090.193
Positional attacks0.113-0.046-0.057-0.029-0.0120.008-0.0780.097-0.110
Positional attacks with shots0.3710.2420.2110.2480.2500.2780.2280.2270.187
% of efficiency for positional attacks0.4100.2810.2670.2890.2810.3230.2890.2260.241
Counter-attacks0.047-0.0230.0170.046-0.0080.1410.0790.0400.132
Counter-attacks with a shot0.2770.2440.2500.2830.2920.3350.2780.2880.328
% of efficiency for counterattacks0.2800.2480.2720.3000.3490.2630.2810.3040.292
Set pieces attacks0.016-0.0690.017-0.094-0.024-0.054-0.0290.105-0.038
Attacks with shots – Set pieces attacks0.1670.0570.1620.1230.1100.0830.1440.2400.113
% of efficiency for set-piece attacks0.2170.1460.1630.2680.1880.1720.2180.2860.174
Free-kick attacks-0.090-0.164-0.047-0.117-0.142-0.198-0.086-0.038-0.054
Free-kick attacks with shots0.033-0.0620.0570.048-0.017-0.1000.0090.1240.048
% of efficiency for free-kick attacks0.0930.0740.0820.1440.0590.0170.0750.1840.078
Corner attacks0.0920.0280.0070.0660.0440.0700.0350.1760.003
Corner attacks with shots0.1520.0580.0910.1190.0870.1400.1540.1810.087
% of efficiency for corner attacks0.1210.0690.1220.1110.1040.1360.1580.1530.130
Throw-in attacks-0.085-0.0820.033-0.212-0.064-0.058-0.078-0.079-0.098
Throw-in attacks with shots-0.042-0.0300.037-0.123-0.037-0.050-0.062-0.030-0.086
% of efficiency for throw-in attacks0.000-0.033-0.013-0.083-0.034-0.037-0.039-0.046-0.119
Free-kick shots0.009-0.0550.0730.0190.007-0.0910.0060.0410.061
Goals – Free-kick attack0.0380.0580.1710.2110.1730.0770.0800.1510.161
% scored free kick shots0.0330.0620.1860.2030.1690.0840.0800.1040.153

If we highlight corelations stronger than +/- 0,275 than we have different table:

Table 4.: Highlight of correlations stronger than +/-0,275 between goals and different aspects of game per countries

GOALSEnglandSpainFranceGermanyItalyAustriaBelgiumCroatiaPoland
Attacks with shots – center0.3940.2340.2970.2790.2290.2990.1700.1750.226
Efficiency for attacks through the central zone, %0.3220.2220.2580.2330.2240.2970.1800.1680.228
Efficiency for attacks through the right flank, %0.2710.2210.2170.2220.2630.2770.2680.2090.193
Positional attacks with shots0.3710.2420.2110.2480.2500.2780.2280.2270.187
% of efficiency for positional attacks0.4100.2810.2670.2890.2810.3230.2890.2260.241
Counter-attacks with a shot0.2770.2440.2500.2830.2920.3350.2780.2880.328
% of efficiency for counterattacks0.2800.2480.2720.3000.3490.2630.2810.3040.292
% of efficiency for set-piece attacks0.2170.1460.1630.2680.1880.1720.2180.2860.174

There is similarity between correlations with “create a chance” and “score a goal”. Again, England (7) and Austria (6) have most correlations above +/- 0,275, while least France (2) and Poland (2). Corelations which are most common are “% of efficiency for positional attacks” (Spain, France, Croatia and Poland excluded), “Counter-attacks with a shot” (Spain and France excluded) and “% of efficiency for counterattacks” (Spain and Austria excluded). On the other side there are some specifies like “Efficiency for attacks through the central zone, %”, “Efficiency for attacks through the right flank, %” and “Positional attacks with shots” for England and Austria and “% of efficiency for set-piece attacks” for Croatia.

Even weaker correlations are with “not defeat”.

Table 5.: Heatmap of correlations between not defeat and different aspects of game per countries

NOT DEFEATEnglandSpainFranceGermanyItalyAustriaBelgiumCroatiaPoland
Attacks – left flank0.0570.011-0.0030.0240.0140.017-0.0130.095-0.024
Attacks with shots – left flank0.2090.1050.0570.1320.1830.1520.1210.1980.165
Efficiency for attacks through the left flank, %0.1980.0960.0600.1460.1890.1570.1460.1600.192
Attacks – center0.1720.0040.0900.0990.1110.0280.0640.0960.084
Attacks with shots – center0.2830.1260.1670.1550.1850.1270.0910.0700.175
Efficiency for attacks through the central zone, %0.2210.1280.1550.1060.1620.1220.0770.0230.132
Attacks – right flank0.0880.005-0.0590.0120.035-0.0140.0250.207-0.126
Attacks with shots – right flank0.1870.0840.1280.1300.1510.1480.1640.1790.093
Efficiency for attacks through the right flank, %0.1760.0810.1590.1420.1420.1870.1710.1210.131
Positional attacks0.144-0.003-0.0110.0340.042-0.048-0.0190.193-0.141
Positional attacks with shots0.2650.0980.1200.1670.1700.1400.0990.1810.114
% of efficiency for positional attacks0.2600.0970.1440.1720.1760.1860.1200.1260.163
Counter-attacks0.1080.0410.0490.1180.1270.1560.1510.1190.211
Counter-attacks with a shot0.2580.1780.1610.1530.2550.2010.2210.1920.276
% of efficiency for counterattacks0.2200.1580.1470.1180.2400.1400.2150.1690.211
Set pieces attacks0.073-0.0710.043-0.0460.037-0.011-0.0080.124-0.009
Attacks with shots – Set pieces attacks0.1720.0300.0960.1130.098-0.0070.0990.2290.032
% of efficiency for set-piece attacks0.1740.0820.0550.2040.1000.0340.1340.2220.073
Free-kick attacks-0.049-0.097-0.027-0.106-0.060-0.130-0.074-0.035-0.053
Free-kick attacks with shots0.029-0.0400.0440.0050.017-0.1290.0130.082-0.012
% of efficiency for free-kick attacks0.0490.0500.0920.0680.051-0.0430.0680.1050.026
Corner attacks0.134-0.0400.0350.0340.0810.0950.0350.1640.039
Corner attacks with shots0.1830.0390.0450.1180.0710.0920.0890.2000.073
% of efficiency for corner attacks0.1390.0700.0110.0920.0500.0920.0950.1370.085
Throw-in attacks-0.040-0.0160.050-0.051-0.034-0.041-0.0130.029-0.045
Throw-in attacks with shots-0.018-0.0070.0180.014-0.001-0.087-0.0070.038-0.107
% of efficiency for throw-in attacks0.013-0.014-0.0400.027-0.005-0.1100.020-0.011-0.135
Free-kick shots0.023-0.0770.029-0.0120.043-0.0500.008-0.0170.034
Goals – Free-kick attack0.052-0.0210.0950.0650.0470.0250.0240.0580.054
% scored free kick shots0.056-0.0130.0850.0530.0450.0390.0240.0380.048

If we highlight correlations stronger than +/- 0,200 we will see that overall number of correlations is smaller than for previous two criteriums.

 Table 5.: Highlight of correlations stronger than +/- 0,200 between not defeat and different aspects of game per countries

NOT DEFEATEnglandSpainFranceGermanyItalyAustriaBelgiumCroatiaPoland
Attacks with shots – left flank0.2090.1050.0570.1320.1830.1520.1210.1980.165
Attacks with shots – center0.2830.1260.1670.1550.1850.1270.0910.0700.175
Efficiency for attacks through the central zone, %0.2210.1280.1550.1060.1620.1220.0770.0230.132
Positional attacks with shots0.2650.0980.1200.1670.1700.1400.0990.1810.114
% of efficiency for positional attacks0.2600.0970.1440.1720.1760.1860.1200.1260.163
Counter-attacks0.1080.0410.0490.1180.1270.1560.1510.1190.211
Counter-attacks with a shot0.2580.1780.1610.1530.2550.2010.2210.1920.276
% of efficiency for counterattacks0.2200.1580.1470.1180.2400.1400.2150.1690.211
Attacks with shots – Set pieces attacks0.1720.0300.0960.1130.098-0.0070.0990.2290.032
% of efficiency for set-piece attacks0.1740.0820.0550.2040.1000.0340.1340.2220.073
Corner attacks with shots0.1830.0390.0450.1180.0710.0920.0890.2000.073

England is having most correlations (7) while Spain, France and Austria have no single correlation stronger than +/- 0,200. “Counter-attacks with a shot”  (England, Italy and Poland) and “% of efficiency for counterattacks” (England, Italy, Belgium and Poland)  is most common aspect of game in correlations. Strongest correlation is and “% of efficiency for counterattacks” in Poland (0,276).

Finally, are presented correlations with “victory” which are stronger than correlations with “not defeat”.

Table 7.: Heatmap of correlations between victory and different aspects of game per countries

VICTORYEnglandSpainFranceGermanyItalyAustriaBelgiumCroatiaPoland
Attacks – left flank0.021-0.014-0.011-0.002-0.014-0.020-0.0290.118-0.054
Attacks with shots – left flank0.2210.1300.0860.1770.1790.1430.1310.2110.116
Efficiency for attacks through the left flank, %0.2350.1460.0800.2010.1910.1690.1610.1740.151
Attacks – center0.1540.0700.0860.0950.0760.0450.0510.0880.049
Attacks with shots – center0.2810.1730.1580.1640.1960.2060.0710.1740.214
Efficiency for attacks through the central zone, %0.2280.1430.1350.1250.1800.2000.0600.1390.213
Attacks – right flank0.056-0.065-0.130-0.072-0.0190.0330.0010.101-0.115
Attacks with shots – right flank0.1830.1310.0840.1220.1950.1270.1760.1860.115
Efficiency for attacks through the right flank, %0.1790.1610.1620.1670.2060.1330.1840.1660.169
Positional attacks0.115-0.018-0.074-0.0060.010-0.065-0.0210.155-0.139
Positional attacks with shots0.2870.1460.1130.1880.1830.1070.1080.1850.099
% of efficiency for positional attacks0.2960.1710.1660.2150.1970.1480.1330.1530.155
Counter-attacks0.0420.0000.0750.0360.0220.2280.0680.0740.122
Counter-attacks with a shot0.2280.2250.1610.1740.2770.3260.2080.3190.325
% of efficiency for counterattacks0.2280.2220.1490.1790.3000.2140.2210.3160.311
Set pieces attacks-0.002-0.101-0.013-0.114-0.055-0.037-0.0860.044-0.066
Attacks with shots – Set pieces attacks0.1420.0110.0500.0590.036-0.0010.0650.1940.004
% of efficiency for set-piece attacks0.1950.0850.0390.1940.1220.0230.1570.2640.076
Free-kick attacks-0.135-0.200-0.051-0.112-0.156-0.169-0.098-0.075-0.099
Free-kick attacks with shots0.003-0.0880.0090.047-0.029-0.1150.0060.068-0.047
% of efficiency for free-kick attacks0.0850.0490.0270.1350.056-0.0180.0740.1120.017
Corner attacks0.1130.006-0.022-0.0060.0350.109-0.0250.1170.010
Corner attacks with shots0.1440.030-0.0050.0180.0320.0730.0700.1990.044
% of efficiency for corner attacks0.0970.0220.0000.0270.0410.0350.0870.1980.080
Throw-in attacks-0.099-0.0590.025-0.148-0.083-0.081-0.087-0.066-0.099
Throw-in attacks with shots0.005-0.0220.015-0.053-0.044-0.067-0.072-0.085-0.103
% of efficiency for throw-in attacks0.045-0.017-0.023-0.030-0.056-0.082-0.033-0.130-0.126
Free-kick shots0.054-0.0880.0390.045-0.019-0.1030.0240.0170.000
Goals – Free-kick attack0.055-0.0300.0890.1460.0870.0720.0450.0750.100
% scored free kick shots0.046-0.0270.1130.1310.0900.0790.0520.0380.094

If we highlight correlations stronger than +/- 0,200 we will see that overall number of correlations is higher than for previous criterium.

Table 7.: Highlight of correlations between victory and different aspects of game per countries

VICTORYEnglandSpainFranceGermanyItalyAustriaBelgiumCroatiaPoland
Attacks with shots – left flank0.2210.1300.0860.1770.1790.1430.1310.2110.116
Efficiency for attacks through the left flank, %0.2350.1460.0800.2010.1910.1690.1610.1740.151
Attacks with shots – center0.2810.1730.1580.1640.1960.2060.0710.1740.214
Efficiency for attacks through the central zone, %0.2280.1430.1350.1250.1800.2000.0600.1390.213
Efficiency for attacks through the right flank, %0.1790.1610.1620.1670.2060.1330.1840.1660.169
Positional attacks with shots0.2870.1460.1130.1880.1830.1070.1080.1850.099
% of efficiency for positional attacks0.2960.1710.1660.2150.1970.1480.1330.1530.155
Counter-attacks0.0420.0000.0750.0360.0220.2280.0680.0740.122
Counter-attacks with a shot0.2280.2250.1610.1740.2770.3260.2080.3190.325
% of efficiency for counterattacks0.2280.2220.1490.1790.3000.2140.2210.3160.311
% of efficiency for set-piece attacks0.1950.0850.0390.1940.1220.0230.1570.2640.076

Again, England have most correlations (8), while France has no correlations stronger than +/- 0,200. Most common correlations are with “Counter-attacks with a shot” and “% of efficiency for counterattacks” (France and Germany excluded for both). Strongest correlation is with “Counter-attacks with a shot” in Austria.

Models for observed criteriums

Following models will indicate to us what is specific for reaching a criterium. For each criterium, models are presented for each country. In each of tables for regression models, green will be marked aspects of the game which have statistically positive significant correlation, red will be marked aspects of the game which have statistically negative significant correlation and those aspects of the game which don’t have any statistically significant correlation will not be marked.

It is interesting that in some country’s models have fewer independent variables and in some more. It might be that in countries with less variables, each of those independent variables are more influential on dependent variable than in models with more independent variables in the model. It means that experts would have less variables to focus if they would use this model to improve chances, goals, not being defeated or winning. Also seeing variables in chances, one can see where clubs from certain country are generally focused to create chances from. It might be interesting for planning matches against such clubs. Of course, it is not the same for all clubs from certain league since it can oscillate significantly but still it might open some new perspectives on playing style from clubs of observed leagues.

Regression models for “create a chance”

Adjusted R square is strong (very high) for “create chance” criterium, for all countries above 0,800. It goes from 0,810 in France till 0.851 in Belgium. Although some variables are unique present in all models, there are differences between leagues. All leagues uniquely have key passes accurate and shots on target in the model, almost all have entrance to the penalty box (Germany don’t) and shots on post/bar (England don’t).

England is country with 10 variables in the model. It has one variable which have negative significant correlation with chances in England, red cards and it should be reduced to achieve more chances logically. Also, it is uniqueness of their model together with blocked shots and defensive challenges won.

England 2021/22
Adj. R sq. 0,824
Key passes accurate
Shots
Blocked shots
Shots wide
Attacks with shots – Set pieces attacks
Free-kick shots
Entrance to the penalty box
Shots on target
Red cards
Defensive challenges won

In England highest correlation with “create a chance” have “Positional attacks with shots” (0.579) and “% of efficiency for positional attacks” (0,538). Highlighted correlation in England are “Attacks with shots – left flank”, “Attacks with shots – center”, “Attacks with shots – right flank”, “Attacks with shots – Set pieces attacks”, “Corner attacks” and “Corner attacks with shots”. Only “Attacks with shots – Set pieces attacks” are present both in model and significant correlation. In this model there is “red card” aspect coloured in red which means this aspect should be reduced to reach a criterium in opposite to green ones which should be intensified.

Spain is country with 15 variables in the model. Uniqueness of their model is attacking challenges won despite big number of variables.

Spain 2021/22
Adj. R sq. 0,817
Key passes accurate
Shots
Shots on target
Entrance to the penalty box
Shots on post / bar
Attacks with shots – Set pieces attacks
Shots wide
Attacking challenges won
Free ball pick ups
% scored free kick shots
Free-kick shots
Free-kick attacks with shots
Corner attacks with shots
Throw-in attacks with shots
Ball recoveries in opponent’s half

In Spain highest correlation with “create a chance” have “Positional attacks with shots” (0.547) and “% of efficiency for positional attacks” (0,516). Highlighted correlation in Spain are “Attacks with shots – left flank”, “Attacks with shots – center”, “Attacks with shots – right flank”, “Attacks with shots – Set pieces attacks”, “Corner attacks” and “Corner attacks with shots”.

France is country with 13 variables in the model and the smallest adjusted R square number. Uniqueness of their model are % of efficiency for corner attacks and % of efficiency for throw-in attacks.

France 2021/22
Adj. R sq. 0,810
Key passes accurate
Shots on target
Entrance to the penalty box
Attacks with shots – Set pieces attacks
Shots wide
Shots on post / bar
Goals – Free-kick attack
Crosses
% scored free kick shots
% of efficiency for throw-in attacks
Tactics
Ball recoveries in opponent’s half
% of efficiency for corner attacks

In France highest correlation with “create a chance” have “Positional attacks with shots” (0.512) and “% of efficiency for positional attacks” (0,479). Highlighted correlation in France is just one more – “Attacks with shots – center”.

Germany is country with 12 variables in the model. Uniqueness of their model are dribbles successful and fouls. Fouls are having negative significant Pearson correlation with chances.

Germany 2021/22
Adj. R sq. 0,834
Key passes accurate
Shots
Shots on target
Shots on post / bar
Attacks with shots – Set pieces attacks
Dribbles successful
Key passes
Accurate crosses, %
Free ball pick ups
Fouls
Goals – Free-kick attack
Free-kick attacks

In Germany highest correlation with “create a chance” have “Positional attacks with shots” (0.547) and “% of efficiency for positional attacks” (0,532). Highlighted correlation in Germany is, as in France just one more – “Attacks with shots – center”.

Italy is country with most variables (18) in the model. Uniqueness of their model are crosses accurate, corner attacks, counter-attacks with a shot and ball recoveries.

Italy 2021/22
Adj. R sq. 0,841
Key passes accurate
Shots on target
Entrance to the penalty box
Shots on post / bar
Attacks with shots – Set pieces attacks
Free ball pick ups
Corner attacks
Counter-attacks with a shot
Key passes
Crosses
Crosses accurate
Free-kick shots
Free-kick attacks with shots
Corner attacks with shots
Throw-in attacks with shots
Shots wide
Ball recoveries in opponent’s half

In Italy highest correlation with “create a chance” have “Positional attacks with shots” (0.532) and “% of efficiency for positional attacks” (0,504). Highlighted correlation in Spain are “Attacks with shots – left flank”, “Efficiency for attacks through the left flank, %”, “Attacks with shots – right flank”, “Counter-attacks with a shot“, “Attacks with shots – Set pieces attacks”, “Corner attacks” and “Corner attacks with shots”. Only “Attacks with shots – Set pieces attacks” and “Counter-attacks with a shot” are present both in model and significant correlation.

Austria has less variables than average (9) and have uniqueness in Ball possession, sec., Throw-in attacks and Ball possession, %.

Austria 2021/22
Adj. R sq. 0,822
Key passes accurate
Shots
Shots on target
Free-kick shots
Entrance to the penalty box
Shots on post / bar
Ball possession, sec
Throw-in attacks
Ball possession, %

In Austria highest correlation with “create a chance” have “Positional attacks with shots” (0.558) and “% of efficiency for positional attacks” (0,536). Highlighted correlation in Austria are “Attacks with shots – center”, “Attacks with shots – right flank”, “Efficiency for attacks through the right flank, %” and “Corner attacks”.

Belgium is country with least variables (8) in the model and highest adjusted R square. There is no uniqueness in their model. They have tactics as well as France.

Belgium 2021/22
Adj. R sq. 0,851
Key passes accurate
Shots on target
Entrance to the penalty box
Shots on post / bar
Attacks with shots – Set pieces attacks
Tactics
Crosses
Shots wide

In Belgium highest correlation with “create a chance” have “Positional attacks with shots” (0.568) and “% of efficiency for positional attacks” (0,543). Highlighted correlation in Belgium are “Attacks with shots – right flank”, “Set pieces attacks”, “Attacks with shots – Set pieces attacks”, “Corner attacks” and “Corner attacks with shots”. Only “Attacks with shots – Set pieces attacks” are present both in model and significant correlation.

Croatia is country with 10 variables in the model. Uniqueness of their model is tackles, air challenges won, % and positional attack.

Croatia 2021/22
Adj. R sq. 0,829
Key passes accurate
Shots on target
Shots on post / bar
Entrance to the penalty box
Goals – Free-kick attack
Attacks with shots – Set pieces attacks
Tackles
Accurate crosses, %
Air challenges won, %
Positional attacks

In Croatia highest correlation with “create a chance” have “Positional attacks with shots” (0.505) and Attacks with shots – Set pieces attacks” (0,496). Highlighted correlation in Croatia are “Attacks with shots – right flank”, “Set pieces attacks”, “% of efficiency for positional attacks”, “Corner attacks” and “Corner attacks with shots”. Only “Attacks with shots – Set pieces attacks” are present both in model and significant correlation.

Poland is country with 12 variables in the model. Uniqueness of their model is key passes, attacks with shots – left flank, % of efficiency for set-piece attacks and challenges in attack won, %.

Poland 2021/22
Adj. R sq. 0,820
Key passes accurate
Shots on target
Shots
Shots on post / bar
Entrance to the penalty box
Free-kick shots
Crosses
Key passes
Counter-attacks
Attacks with shots – left flank
% of efficiency for set-piece attacks
Challenges in attack won, %

In Poland highest correlation with “create a chance” have “Positional attacks with shots” (0.537) and Attacks with shots – Set pieces attacks” (0,527). Highlighted correlation in Poland are “Attacks with shots – left flank”, “Efficiency for attacks through the left flank, %”, “Counter-attacks with a shot” and “% of efficiency for counterattacks”.

Regression models for “score a goal”

To score a goal is more difficult to predict than to make chances. Still, adjusted R square is still moderate to strong around 0,500. On the other side, in models for “goals” is much more variables with negative significant Pearson correlation and every model have at least one of such variables, so, have in mind to see those variables as those which should be reduced in potential game plan. Variable which is present in all models is shots on target.

England has 11 variables in the model. Uniqueness of their model are ball recoveries in opponent’s half and crosses accurate.

England 2021/22
Adj. R sq. 0,497
Shots on target
Crosses
Key passes accurate
Lost balls
Defensive challenges won
Corners
Ball recoveries in opponent’s half
Opponent’s passes per defensive action
Crosses accurate
Offsides
Free-kick shots

In England highest correlation with “score a goal” have “% of efficiency for positional attacks” (0.410). Highlighted correlation in England are “Attacks with shots – center”, “Efficiency for attacks through the central zone, %”, “Efficiency for attacks through the right flank, %”, “Positional attacks with shots”, “Counter-attacks with a shot” and “% of efficiency for counterattacks”. In this model there is “lost balls” and “offsides” red marked. So, if you want to score a goal, reduce lost balls and offsides if you are playing in England. Let’s see is are the same aspects of the game indicative in the other countries.

Spain has 17 variables in the model. Uniqueness of their model are entrance to the penalty box and accurate passes.

Spain 2021/22
Adj. R sq. 0,498
Shots on target
Crosses
Key passes accurate
Shots
Opponent’s passes per defensive action
Defensive challenges won
Free-kick attacks
Ball possession, sec
Ball possession, %
Entrance to the penalty box
Corners
Positional attacks
Ball recoveries
Lost balls
Accurate passes, %
Accurate passes
% scored free kick shots

In Spain there is no significant correlation stronger than +/- 0,275. Still be aware of red ones in the model 😉 and enhance green ones.

France has 13 variables in the model. Uniqueness of their model are team pressing, challenges won, % and efficiency for attacks through the central zone, %.

France 2021/22
Adj. R sq. 0,463
Shots on target
Crosses
Key passes accurate
% scored free kick shots
Yellow cards
Lost balls
Corners
Opponent’s passes per defensive action
Team pressing
Challenges won, %
Shots on target, %
Efficiency for attacks through the central zone, %
Defensive challenges won

In France highest correlation with “score a goal” have “Attacks with shots – center” (0.297). Highlighted correlation in France is “% of efficiency for counterattacks”. “Lost balls”, “Crosses” and “yellow cards” are to be reduced.

Germany has 15 variables in the model and highest adjusted R square number. Uniqueness of their model are attacking challenges and average duration of ball possession, min.

Germany 2021/22
Adj. R sq. 0,525
Shots on target
Crosses
Key passes
Attacking challenges
Goals – Free-kick attack
Shots on target, %
% of efficiency for set-piece attacks
% of efficiency for counterattacks
Ball possession, %
Ball possession, sec
Average duration of ball possession, min
Ball possessions, quantity
Ball recoveries
Offsides
Yellow cards

In Germany highest correlation with “score a goal” have “% of efficiency for counterattacks” (0.300). Highlighted correlation in Germany are “Attacks with shots – center”, “% of efficiency for positional attacks” and “Counter-attacks with a shot”. “Ball possessions, quantity”, “Crosses” and “yellow cards” are to be reduced.

Italy has 20 variables in the model and highest adjusted R square number. Uniqueness of their model are set pieces attacks, challenges in attack won, %, free ball pick ups, throw-in attacks, tackles won, %, efficiency for attacks through the left flank, % and efficiency for attacks through the right flank, %.

Italy 2021/22
Adj. R sq. 0,483
Shots on target
Set pieces attacks
Goals – Free-kick attack
Key passes
Crosses
% of efficiency for counterattacks
Shots wide
Entrance to the penalty box
Dribbles
Challenges in attack won, %
Opponent’s passes per defensive action
Free ball pick ups
Corner attacks
Free-kick attacks
Throw-in attacks
Tackles won, %
Shots on target, %
Efficiency for attacks through the left flank, %
% of efficiency for set-piece attacks
Efficiency for attacksthrough the right flank, %

In Italy highest correlation with “score a goal” have “% of efficiency for counterattacks” (0.349). Highlighted correlation in Germany are “% of efficiency for positional attacks” and “Counter-attacks with a shot”. Interesting, red marked in Italy are “Free ball pick ups” and “Free-kick attacks”.

Austria has 15 variables in the model and smallest adjusted R square. Uniqueness of their model are ball recoveries in opponent’s half, total actions, and dribbles.

Austria 2021/22
Adj. R sq. 0,441
Shots on target
Positional attacks
Free-kick shots
Key passes accurate
Throw-in attacks with shots
Ball recoveries in opponent’s half
Goals – Free-kick attack
Opponent’s passes per defensive action
Ball possessions, quantity
Total actions
Ball recoveries
Dribbles
Ball possession, %
Free-kick attacks
Ball possession, sec

In Austria highest correlation with “score a goal” have “Counter-attacks with a shot” (0.335). Highlighted correlation in Austria are “Attacks with shots – center”, “Efficiency for attacks through the central zone, %”, “Efficiency for attacks through the right flank, %”, “Positional attacks with shots” and “% of efficiency for positional attacks”. “Free-kick attacks” are to be reduced.

Belgium has most variables in the model (21). Uniqueness of their model are ball recoveries in opponent’s half, total actions and dribbles.

Belgium 2021/22
Adj. R sq. 0,473
Shots on target
Crosses
Lost balls
Key passes
Corner attacks
Yellow cards
Team pressing successful
Accurate passes, %
Free-kick attacks
Ball possession, %
Ball possession, sec
Ball recoveries
Opponent’s passes per defensive action
Free ball pick ups
Shots wide
% of efficiency for corner attacks
% of efficiency for counterattacks
Blocked shots
% of efficiency for positional attacks
Attacks with shots – Set pieces attacks
Throw-in attacks with shots

In Belgium highest correlation with “score a goal” have “% of efficiency for positional attacks” (0.289). Highlighted correlation in Belgium are “Counter-attacks with a shot” and “% of efficiency for counterattacks”. “Crosses”, “Lost balls”, “Yellow cards” and “Free-kick attacks” are to be reduced.

Croatia has the least number of variables (9) in the model. Uniqueness of their model is air challenges.

Croatia 2021/22
Adj. R sq. 0,449
Shots on target
Key passes accurate
Crosses
Goals – Free-kick attack
Air challenges
% of efficiency for set-piece attacks
Shots wide
% of efficiency for counterattacks
Fouls

In Croatia highest correlation with “score a goal” have “% of efficiency for counterattacks” (0.304). Highlighted correlation in Croatia are “Counter-attacks with a shot” and “% of efficiency for set-piece attacks”. “Crosses” is to be reduced.

Poland has 12 variables in the model. Uniqueness of their model are % of efficiency for throw-in attacks and counter-attacks with a shot.

Poland 2021/22
Adj. R sq. 0,465
Shots on target
Crosses
Key passes accurate
Shots wide
Lost balls
Ball recoveries
Goals – Free-kick attack
Corners
% of efficiency for throw-in attacks
% of efficiency for corner attacks
Counter-attacks with a shot
Fouls

In Poland highest correlation with “score a goal” have “Counter-attacks with a shot” (0.328). Highlighted correlation in Poland is “% of efficiency for counterattacks”. “Crosses”, “Lost balls” and “% of efficiency for throw-in attacks” is to be reduced.

Regression models for “not defeat”

Not to be defeated is most difficult to predict of all four observed variables. Adjusted R square is weak, just beneath 0,300 with few exceptions. Models for “not defeat” have least variables per model. In this models, negative significant Pearson correlation is present except for Croatia. Have in mind to see those variables as those which should be reduced in potential game plan. There is no single variable present in all models.

England has 15 variables in the model and highest adjusted R square. Uniqueness of their model are entrance to the penalty box, defensive challenges won, offsides, tackles successful, yellow cards and average duration of ball possession, min.

England 2021/22
Adj. R sq. 0,299
Shots on target
Opponent’s passes per defensive action
Crosses accurate
Key passes accurate
Entrance to the penalty box
Crosses
Ball interceptions
Ball recoveries in opponent’s half
Lost balls
Defensive challenges won
“
Offsides
Tackles successful
Yellow cards
Average duration of ball possession, min

In England highest correlation with “not defeat” have “Attacks with shots – center” (0.283). Highlighted correlation in England are “Attacks with shots – left flank”, “Efficiency for attacks through the central zone, %”, “Positional attacks with shots”, “% of efficiency for positional attacks”, “Counter-attacks with a shot” and “% of efficiency for counterattacks”. In this model red marked are “Opponent’s passes per defensive action”, “Lost balls”, “Lost balls” and “Offsides”. So, if you want not to be defeated, reduce them.

Spain has 13 variables in the model. Uniqueness of their model are ball possessions – quantity, attacks – centre, defensive challenges and attacking challenges.

Spain 2021/22
Adj. R sq. 0,231
Shots on target
Opponent’s passes per defensive action
Crosses
Key passes
Ball recoveries
Ball possessions, quantity
Fouls
Attacks – center
Defensive challenges
Attacking challenges
Dribbles successful
Shots wide
Shots on target, %

In Spain there is no significant correlation above +/- 0,200.  In this model red marked are “Opponent’s passes per defensive action” and “Crosses”.

France has least number of variables (6) in the model. This model has no uniqueness.

France 2021/22
Adj. R sq. 0,165
Shots on target
Challenges won, %
Crosses
Ball interceptions
Key passes accurate
Entrance to the penalty box

In France there is also no significant correlation above +/- 0,200.  In this model there red marked is “Crosses”.

Germany has most variables (18) variables in the model and smallest adjusted R square. It has most unique variables of all models for “not defeat”. Uniqueness of their model are set pieces attacks, challenges, total actions, shots on post / bar, accurate passes, shots and entrances to the opposition half.

Germany 2021/22
Adj. R sq. 0,292
Shots on target
Opponent’s passes per defensive action
Set pieces attacks
Key passes
Accurate passes, %
Successful actions, %
% of efficiency for set-piece attacks
Challenges
Total actions
Challenges won
Shots on post / bar
Accurate passes
Ball recoveries
Shots
Entrances to the opposition half
Positional attacks
Free-kick attacks with shots
Air challenges won, %

In Germany there is just one significant correlation with “not defeat” – “% of efficiency for set-piece attacks” (0.204). In this model red marked is “Opponent’s passes per defensive action”.

Italy has 10 variables in the model. This model has no uniqueness.

Italy 2021/22
Adj. R sq. 0,228
Shots on target
Opponent’s passes per defensive action
% of efficiency for counterattacks
Challenges won, %
Crosses
Key passes
Red cards
Ball recoveries in opponent’s half
Lost balls
Ball recoveries

In Italy there are two significant correlation with “not defeat” – “Counter-attacks with a shot” (0.255) and “% of efficiency for counterattacks”. In this model red marked are “Opponent’s passes per defensive action” and “Red cards”.

Austria has 13 variables in the model. Uniqueness of their model are % of efficiency for throw-in attacks, team pressing successful and air challenges.

Austria 2021/22
Adj. R sq. 0,282
Key passes accurate
Fouls
Shots on target, %
% of efficiency for throw-in attacks
Challenges won, %
Free-kick attacks with shots
Crosses accurate
Team pressing successful
Lost balls
Ball recoveries
Accurate passes, %
Successful actions, %
Air challenges

In Austria there is no significant correlation above +/- 0,200.  In this model red marked are “% of efficiency for throw-in attacks”, “Free-kick attacks with shots” and “Lost balls”.

Belgium has 12 variables in the model. Uniqueness of their model is pressing efficiency, %.

Belgium 2021/22
Adj. R sq. 0,231
Shots on target
Ball interceptions
Key passes
Crosses
Air challenges won, %
% of efficiency for counterattacks
Ball recoveries
Dribbles successful
Pressing efficiency, %
Lost balls in own half
Challenges won, %
Shots on target, %

In Belgium there is just one significant correlation with “not defeat” – “% of efficiency for counterattacks” (0.215). In this model red marked is “Crosses”.

Croatia has 7 variables in the model. Uniqueness of their model are air challenges won and efficiency for attacks through the left flank, %.

Croatia 2021/22
Adj. R sq. 0,221
Shots on target
Air challenges won
% of efficiency for set-piece attacks
Key passes accurate
Shots wide
Ball recoveries in opponent’s half
Efficiency for attacks through the left flank, %

In Croatia highest correlation with “not defeat” have “Attacks with shots – Set pieces attacks” (0.229). Highlighted correlation in Croatia are “% of efficiency for set-piece attacks” and “Corner attacks with shots”. In this model there is no red marked aspect of the game.

Poland has 10 variables in the model. Uniqueness of their model are lost balls in own half, free-kick attacks and tactics.

Poland 2021/22
Adj. R sq. 0,248
Shots on target
Positional attacks
Ball recoveries
Lost balls in own half
% of efficiency for throw-in attacks
Challenges won
Key passes accurate
Crosses
Free-kick attacks
Tactics

In Poland highest correlation with “not defeat” have “Counter-attacks with a shot” (0.276). Highlighted correlation in Croatia are “Counter-attacks” and “% of efficiency for counterattacks”. In this model red marked aspects of the game are “Positional attacks”, “Lost balls in own half”, “% of efficiency for throw-in attacks” and “Crosses”.

Regression models for victory

Although all of models has it purpose in planning the game, and it might be that is best to observe them all in planning, victory might be the most interesting because victory brings most to the team, players, coach, and the club. Adjusted R square is between moderate and weak, from 0,225 to 0,364. There is no single variable which is present in all models. So, lets see “how to win a match in England”

England has 17 variables in the model. Uniqueness of their model are successful actions, defensive challenges won, total actions, entrances to the final third and challenges.

England 2021/22
Adj. R sq. 0,355
Shots on target
Crosses
Successful actions
Air challenges won, %
Free-kick attacks
% of efficiency for throw-in attacks
Lost balls in own half
Red cards
Defensive challenges won
Key passes accurate
Total actions
Tackles successful
Entrances to the final third
Crosses accurate
Challenges
Opponent’s passes per defensive action
Team pressing

In England highest correlation with “victory” have “% of efficiency for positional attacks” (0.296). Highlighted correlation in England are “Attacks with shots – left flank”, “Efficiency for attacks through the left flank, %”, “Attacks with shots – center”, “Efficiency for attacks through the central zone, %”, “Positional attacks with shots “, “Counter-attacks with a shot” and “% of efficiency for counterattacks”. In this model red marked are “Free-kick attacks”, “Lost balls in own half”, “Red cards”, “Crosses accurate” and “Opponent’s passes per defensive action”. So, if you want to win the match, reduce them and enhance the green ones.

Spain has the most variables (19) of all models. Uniqueness of their model are air challenges won, entrances to the opposition half, offsides and shots.

Spain 2021/22
Adj. R sq. 0,331
Shots on target
Crosses
Key passes
Opponent’s passes per defensive action
Free-kick attacks
Air challenges won
Ball interceptions
Successful actions, %
Fouls
Red cards
Dribbles successful
Attacking challenges won
Counter-attacks with a shot
Entrances to the opposition half
Offsides
Set pieces attacks
Ball recoveries
Lost balls
Shots

In Spain highest correlation with “victory” have “Counter-attacks with a shot” (0.225). Highlighted correlation in Spain is “% of efficiency for counterattacks”. In this model red marked are “Set pieces attacks” and “Lost balls”.

France has 9 of all models. Uniqueness of their model are corner attacks with shots and yellow cards.

France 2021/22
Adj. R sq. 0,241
Shots on target
Crosses
Key passes accurate
Challenges won, %
Ball interceptions
Red cards
Tactics
Corner attacks with shots
Yellow cards

In France there is no significant aspect with more strength than +/- 0,200. In this model red marked are “Crosses”, “Yellow cards” and “Red cards”.

Germany has least variables (6) of all models and weakest model. Uniqueness of their model are challenges in defence won – %, goals – Free-kick attack and shots on post / bar.

Germany 2021/22
Adj. R sq. 0,225
Shots on target
Set pieces attacks
Key passes accurate
Crosses
Challenges in defence won, %
Opponent’s passes per defensive action
Goals – Free-kick attack
Shots on post / bar

In Germany there is just two aspects of the game with correlation with “victory” above +/- 0,200 – “% of efficiency for positional attacks” (0.215) and “Efficiency for attacks through the left flank, %”. In this model red marked are “Set pieces attacks”, “Crosses” and “Opponent’s passes per defensive action”.

Italy has 12 of all models. Uniqueness of their model are accurate passes – %, free ball pick ups – %, and scored free kick shots.

Italy 2021/22
Adj. R sq. 0,301
Shots on target
Crosses
Key passes
Successful actions, %
Opponent’s passes per defensive action
Accurate passes, %
% of efficiency for counterattacks
Free-kick attacks
Air challenges
Free ball pick ups
% scored free kick shots
Tackles successful

In Italy highest correlation with “victory” have “% of efficiency for counterattacks” (0.300). Highlighted correlation in Italy are “Efficiency for attacks through the right flank, %” and “Counter-attacks with a shot”. In this model red marked are “Crosses”, “Opponent’s passes per defensive action”, “Free-kick attacks” and “Free ball pick ups”.

Austria has 12 variables in the model. Uniqueness of their model are shots on target – %, accurate crosses – %, and attacks – centre.

Austria 2021/22
Adj. R sq. 0,304
Counter-attacks with a shot
Key passes accurate
Shots on target, %
Crosses accurate
Red cards
Accurate crosses, %
Tactics
Lost balls in own half
Ball recoveries
Lost balls
Fouls
Attacks – center

In Austria highest correlation with “victory” have “Counter-attacks with a shot” (0.326). Highlighted correlation in Austria are “Attacks with shots – center”, “Efficiency for attacks through the central zone, %”, “Counter-attacks” and “% of efficiency for counterattacks”. In this model red marked is “Red cards”.

Belgium has 12 variables in the model. Uniqueness of their model are challenges in defence won – %, tackles and attacks with shots – centre.

Belgium 2021/22
Adj. R sq. 0,265
Shots on target
Crosses
Key passes
Team pressing
Set pieces attacks
Challenges in defence won,%
Dribbles successful
Tackles
% of efficiency for counterattacks
Attacks with shots – center
Attacking challenges won
Tackles successful

In Belgium highest correlation with “victory” have “% of efficiency for counterattacks” (0.221). Highlighted correlation in Belgium is “Counter-attacks with a shot”. In this model red marked are “Set pieces attacks” and “Crosses”.

Croatia has 10 variables in the model and strongest model. Uniqueness of their model are % of efficiency for set-piece attacks and ball recoveries in opponent’s half.

Croatia 2021/22
Adj. R sq. 0,364
Shots on target
Key passes accurate
% of efficiency for counterattacks
Crosses accurate
% of efficiency for set-piece attacks
% of efficiency for throw-in attacks
Ball interceptions
Ball recoveries in opponent’s half
Shots wide
Air challenges won, %

In Croatia highest correlation with “victory” have “Counter-attacks with a shot” (0.319). Highlighted correlation in Croatia are “Attacks with shots – left flank”, “% of efficiency for counterattacks” and “% of efficiency for set-piece attacks”. In this model red marked is “% of efficiency for throw-in attacks”.

Poland has 12 of all models. There is no uniqueness of their model.

Poland 2021/22
Adj. R sq. 0,306
Shots on target
Crosses
Counter-attacks with a shot
Shots wide
Team pressing
Challenges won, %
“Ball interceptions
Lost balls
Ball recoveries
% of efficiency for throw-in attacks
Air challenges
Free-kick attacks

In Poland highest correlation with “victory” have “Counter-attacks with a shot” (0.325). Highlighted correlation in Croatia are “Attacks with shots – center”, “Efficiency for attacks through the central zone, %” and “% of efficiency for counterattacks”. In this model red marked are “Crosses”, “Lost balls”, “% of efficiency for throw-in attacks” and “Free-kick attacks”.

Check out this article on LinkedIn: https://www.linkedin.com/pulse/do-leagues-generally-differ-between-themselves-pitch-slaven-marasovi%C4%87/

Read More
TOP 75 EUROPEAN CLUBS BY BRAND VALUE

After calculating enterprise value for TOP100 clubs (https://managementoffootball.com/top-100-european-clubs-by-enterprise-value/) in 31 European leagues, I have calculated Brand value of TOP75 clubs from the same leagues.

What is brand value? Brand value is value stated in money somebody would be ready to buy your brand for. It is defined through logo, brand name, and everything what is perceived as indivisible part of your brand identity.

Why is it important? “A brand encompasses the name, logo, image, and perceptions that identify a product, service, or provider in the minds of customers. It takes shape in advertising, packaging, and other marketing communications, and becomes a focus of the relationship with consumers.” Further on, Wikipedia states, that brand equity, defined in marketing as “the worth of a brand in and of itself – i.e., the social value of a well-known brand name” is important for determination of price structure.

By Wikipedia, Interbrand classifies these uses of brand valuation in three categories:

  1. Financial applications (e.g. mergers and acquisitions, balance sheet valuation, investor relations)
  2. Brand management applications (e.g. brand portfolio management, resource allocation)
  3. Strategic / Business case applications (e.g. brand architecture, brand repositioning)

When we talk about methodology, there are different methodologies for calculating brand equity by Wikipedia:

  1. The cost approach (amount of money which someone would use to create the equivalent of observed brand),
  2. The market approach (it is based on comparison of market price of other brands)
  3. The income approach:
    1. Price premium method (price premium it generates comparing with non-branded product similar quality)
    1. Volume premium method (volume premium it generates comparing with non-branded product similar quality)
    1. Income split method
    1. Multi-period excess earnings method
    1. Incremental cash flow method or Excess Margin
    1. Royalty relief method

*More about specific brand methodologies you can find in (Clark, R. (2013): Measuring the Value of Brands) on link: http://www.valcoronline.com/PDFs/Valuing%20Brand%20Equity_10-7-13_vFINAL(rc).pdf

The same logic used in calculations of enterprise value is used here as well. A number of “things” might influence on brand, or if you want strength of brand influence on number of “things”. And those “things” make “footprints” for brand value in the world around us. So, first goal was to identify as many “footprints” as possible and collect data about them. Data I have been using were data which are not data from financial reports. Instead, we have been using a spectrum of external (not from club documents or reports) and exclusively publicly available data.

Same as in enterprise value, the final goal was to find the algorithm in the standardized model for the spectrum of clubs from the lowest brand value in Europe to clubs with the highest enterprise value in Europe (from 0mil € or something less to 1500mil€). For both, enterprise value and brand value, the second goal was to find an algorithm which is time resistant as long as possible. Finally, the algorithm was found using different analyses in inferential statistics and I have made the list of TOP75 clubs in Europe by brand value (MoF further in text).

Same testing was used for brand value as for enterprise value calculation. Before release, an algorithm in a standardized model was tested in several ways. First, algorithm results were checked by logical brand value in reality for the whole span of club values, from lower valued clubs as well as high valued clubs (span should go from 0 to 1500mil€ in the logical sense). The second quality check was confirmed by statistical analysis rules. The third was a comparison with brand value calculated by KPMGs spin-off, Football Benchmark (https://www.footballbenchmark.com/library/football_clubs_valuation_the_european_elite_2022); comparing results of enterprise value with KPMGs spin-off, Football Benchmark we receive 97% of statistically positive significant correlation between results. Forth was using data from years before instead of one, last year.

I have been looking on 11 external areas as “footprints” of what’s happening within the club for a period of time. Those areas are 1. success in European competitions (UEFA), 2. investment in the team, 3. social networks, 4. team structure, 5. value of the team, 6. Sale-buying, 7. stadium, 8. attendance, 9. domestic competition, 10. general environment and 11. football environment. Through different stages of research, we have been using in total more than 170 different variables to find the final standardized algorithm. Also, we have been using data about single variables from 5 years before and for some variables even 10 years before.

We have been analyzing 227 clubs from 36 European leagues. 31 leagues are from the 1st national tier and 5 leagues are from the 2nd national tier:

1ESP – La Liga
2ESP – La Liga 2
3ENG – Premier league
4ENG – Championship
5GER – Bundesliga
6GER – 2. Bundesliga
7FRA – Ligue 1
8FRA – Ligue 2
9ITA – Serie A
10ITA – Serie B
11TUR
12POR
13NED
14SCO
15SVI
16ROU
17UKR
18BEL
19RUS
20GRE
21POL
22SER
23CRO
24AUT
25HUN
26CZE
27DEN
28NOR
29SWE

In the analysis were included all clubs from the Big 5 leagues and the best clubs from other listed leagues. More clubs per league were selected from the following leagues: Netherlands, Portugal, Turkey, Belgium, English Championship and Russia (*this year’s results are not affected by the war in Ukraine for Ukraine and Russian clubs)

Nr.ClubStateBV  mil €
1Real MadridSPA1377
2FC BarcelonaSPA1348
3Manchester UnitedENG1303
4Liverpool FCENG1273
5Bayern MunichGER1183
6Manchester CityENG1143
7Chelsea FCENG1013
8Paris Saint-GermainFRA918
9Tottenham HotspurENG820
10Arsenal FCENG767
11Juventus FCITA678
12Borussia DortmundGER612
13Atlético de MadridSPA533
14Inter MilanITA501
15AC MilanITA378
16Leicester CityENG317
17Everton FCENG313
18SSC NapoliITA305
19AS RomaITA280
20RB LeipzigGER277
21Olympique LyonFRA263
22Bayer 04 LeverkusenGER251
23AFC Ajax AmsterdamNED233
24Olympique MarseilleFRA215
25Valencia CFSPA208
26FC PortoPOR188
27Aston VillaENG187
28West Ham UnitedENG183
29AS MonacoFRA180
30Real SociedadSPA175
31Wolverhampton WanderersENG172
32SL BenficaPOR170
33Newcastle UnitedENG168
34SS LazioITA157
35Sevilla FCSPA153
36Southampton FCENG148
37Galatasaray A.S.TUR146
38Atalanta BCITA143
39LOSC LilleFRA136
40Real Betis BalompiéSPA134
41ACF FiorentinaITA130
42Athletic BilbaoSPA129
43Sporting CPPOR125
44FC Schalke 04GER124
45Fenerbahce SKTUR123
46Crystal PalaceENG122
47Eintracht FrankfurtGER122
48Borussia MönchengladbachGER115
49TSG 1899 HoffenheimGER112
50PSV EindhovenNED108
51Brighton & Hove AlbionENG105
52Villarreal CFSPA103
53Stade Rennais FCFRA96
54VfL WolfsburgGER95
55OGC NiceFRA92
56Leeds UnitedENG86
57Fulham FCENG86
58AFC BournemouthENG84
59Hertha BSCGER83
60FC ZenitRUS82
61Red Bull SalzburgAUT81
62Watford FCENG79
63Feyenoord RotterdamNED79
64VfB StuttgartGER77
65FC Girondins BordeauxFRA76
66SV Werder BremenGER75
67West Bromwich AlbionENG74
68Rangers FCSCO72
69Sheffield UnitedENG70
70Torino FCITA70
71Club Brugge KV BEL70
72TrabzonsporTUR69
73Stoke cityENG68
74AS Saint-ÉtienneFRA67
75Burnley FCENG66
 TOTAL:22,161 bil €

The total value of TOP75 clubs is 22,161 bil. € coming from 12 European leagues with 6 clubs from the 2nd national tier:

 Number of clubs in TOP75Total brand value of clubs per leaguePercent of brand value of clubs from single league in TOP 75Average brand value of clubs per league
ENG23864939%376
SPA9415919%462
GER12312514%260
ITA9264212%294
FRA920429%227
POR34832%161
NED34192%140
TUR33382%113
RUS1820%82
AUT1810%81
SCO1720%72
BEL1700%70

In the above table, values of clubs from a single league were summarized to identify differences between leagues in TOP75 brand value. The highest brand value of clubs from a single league in TOP75 is having English Premier league (8649mil€) followed by Spain La Liga (4159mil€), German Bundesliga (3125mil€), Italy Serie A (2642mil€) and French Ligue 1 (2042mil€). Mosta valuable club from second tier is Fulham (86 mil €). English Premier league is pointed out with more than double as value as Spain La Liga.

If we look at the column “Percent of brand value of clubs from single league in TOP 75” we will see again that the English Premier league pointed out.  85% of clubs from the Premier league, are part of TOP75, followed by German Bunesliga (67%), Italy Serie A (45%), Spain La Liga (45%) and France Ligue 1 (45%).

The column “Average brand value of clubs per league” is the value from all clubs from one league in TOP 75 divided by the number of clubs in the observed league. Leagues with a higher number of clubs will have less average if they have the same number of clubs in the TOP 75 as leagues with fewer clubs in it. Spain La Liga is having is having the highest average (462mil€) followed by Premier league (376mil€), Italian Serie A (294mil€), German Bundesliga (260mil€), and France Ligue 1 (227mil€). In Enterprise value, on first position was Premier league while second was Spanish La Lia.

Those two columns (“Percent of brand value of clubs from single league in TOP 75”, and “Average brand value of clubs per league”) might indicate the concentration of overall brand strength.

If we compare results from the MoF BV list and results from KPMGs spin-off Football Benchmark, clubs which fall of the KPMGs spin-off Football Benchmark list are 1. FC Köln, Celtic FC. On the other side FC Porto, AS Monaco, Real Sociedad, SS Lazio and others came in.

Again, in Brand value as in Enterprise value, it is noticeable that generally Italian clubs are generally higher valued in the Mof BV algorithm than in KPMG’s spin-off, Football Benchmark.

The characteristic of this method is that at any moment value of any club in Europe can be calculated based on publicly available data. Although results were tested with KPMG’s spin-off Football Benchmark and sales which really happened, using financial reports for another step of testing the model would be beneficial. Characteristic of this model is that it is standardized and not influenced by any possible misleading in financial reports.

Model by itself reveals what from reality influences most on the brand value of the clubs and as such, they can be used for setting relevant and measurable goals for the top management of the club, and for setting KPIs for the top management of the clubs regarding either brand or enterprise value.

With enterprise value and brand value research finished, we are moving to next research:

  1. The quality of human capital in club management is interesting as well as sports staff especially. So, on the list of next research is a calculation of:
    1. standardized model of quality of management of clubs and
    1. standardized model of quality of sport management of the club..

Moving from management of the club to the performance on the pitch, research which is almost to be released is about differences per TOP5+4 leagues, trying to identify models how to win, not to lose, score goals or create chances.

If you have any comments, we would be grateful to talk about this, what do you think about the possibility of this kind of calculations of brand value, what do you think about results and do you have maybe any idea about improving this research (combining with financial reports would, of course, be very useful but here is an idea to use date, not from financial research) and about further research. Special thanks goes to all guys from www.managementoffootall.com

Check out this article on LinkedIn: https://www.linkedin.com/pulse/calculated-top75-european-clubs-brand-value-2021-slaven-marasovi%C4%87/

Read More
TOP 100 EUROPEAN CLUBS BY ENTERPRISE VALUE

publicly traded clubs included) without taking into consideration of market capitalization, debt, and cash? Yes, TOP 100 European clubs by enterprise value calculated!

After four months of research, I and my team were dealing with calculations of the enterprise value of TOP 100 European clubs using statistical analysis to find an algorithm that does not use data about market capitalisation, debt, and cash, but data from financial reports.

So, what is enterprise value? It is a value you would pay for business if you were aiming to purchase it or, a value you would receive if you would sell your business. The following formula is used to determine the enterprise values of publicly traded businesses:

Enterprise Value = Market Capitalization + Debt (short and long term) – Cash (and cash equivalents)

But what if you want to buy a club which is not publicly traded? There are several methods how for calculating it:

1.      Comparable Company Analysis (CCA)

2.      Discounted Cash Flow (DCF) method

3.      First Chicago Method

4.      Asset-based method

All of these methods are in more detail explained on the following link (https://corporatefinanceinstitute.com/resources/knowledge/valuation/private-company-valuation/ ), but one can find a lot of literature on the web.

I will just quote snapshots from definitions:

Ad1. The Comparable Company Analysis (CCA) method operates under the assumption that similar firms in the same industry have similar multiples.

Ad2. The Discounted Cash Flow (DCF) method takes the CCA method one step further. As with the CCA method, we estimate the target’s discounted cash flow estimations, based on acquired financial information from its publicly traded peers.

Ad3. The First Chicago Method is a combination of the multiple-based valuation method and the discounted cash flow method. The distinct feature of this method lies in its consideration of various scenarios of the target firm’s payoffs. (Usually, this method involves the construction of three scenarios: a best-case (as stated in the firm’s business plan), a base-case (the most likely scenario), and a worst-case scenario. A probability is assigned to each case.)

Ad 4. The asset-based method is used when is more profitable to liquidate a firm than continue with business because with liquidation firm will have better cash flow than if it continues with business.

If you don’t know which method to use, help could also be found at „The International Valuation Standards Council” – IVSC or national agencies for evaluation of firms.

In this research, the goal was to assess publicly and non-publicly traded clubs to calculate their enterprise value. Since there is no share price for non-traded clubs, we have been looking for the club’s overall environment which would influence on share price to go up or down. There is a lot of literature about reasons for share price fluctuation generally, but also specifically for the football industry as well. Joao Duque and Nuno Abrantes Ferreira from Instituto Superior Economia e Gestao, Universidade Tecnica de Lisbao have found positive relationship between sporting performance and share price. José Allouche from Université de Paris 1 Panthéon-Sorbonne, Paris and Sébastien Soulez from Université Lumiere Lyon 2, Lyon have found that sporting results positively influence on share price after victory and vice versa. Further on, they have found that managerial decisions about running and investing in sporting facilities, sponsoring and positive financial results influence positively the share price and in case of unfavourable financial results influence negatively the share price. Also, they have found the relationship between human resources (players) and share price. Similar is found in Turkey regarding winning (https://www.jstor.org/stable/41343433), where winning in the European cup does not affect club stock share returns while winning in domestic matches does influence positively.

However, a number of “things” might influence share price, and those “things” make “footprints” for enterprise value in the world around us. So, our first goal was to identify as many “footprints” as possible and collect data about them. Data we have been using were data which are not data from financial reports, not data about share prices. Instead, we have been using a spectrum of external (not from club documents or reports) and exclusively publicly available data.

The final goal was to find the algorithm in the standardized model for the spectrum of clubs from the lowest enterprise value in Europe to clubs with the highest enterprise value in Europe (from 0mil € or something less to 3200mil€). The second goal was to find an algorithm which is time resistant as long as possible. Finally, the algorithm was found using different analyses in inferential statistics and we have made the list of TOP100 clubs in Europe by enterprise value (MoF further in text).

Before release, an algorithm in a standardized model was tested in several ways. First, algorithm results were checked by logical enterprise value in reality for the whole span of club values, from lower valued clubs as well as high valued clubs (span should go from 0 to 3200mil€ in the logical sense). The second quality check was confirmed by statistical analysis rules. The third was a comparison with enterprise value calculated by KPMGs spin-off, Football Benchmark (https://www.footballbenchmark.com/library/football_clubs_valuation_the_european_elite_2022); comparing results of enterprise value with KPMGs spin-off, Football Benchmark we receive 99.4% of statistically positive significant correlation between results. The fourth was sales which happened in 2021 in the UEFA report (https://editorial.uefa.com/resources/0272-145b03c04a9e-26dc16d0c545-1000/master_bm_high_res_20220203104923.pdf). Fifth was using data from years before instead of one, last year.

We have been looking on 11 external areas as “footprints” of what’s happening within the club for a period of time. Those areas are 1. success in European competitions (UEFA), 2. investment in the team, 3. social networks, 4. team structure, 5. value of the team, 6. Sale-buying, 7. stadium, 8. attendance, 9. domestic competition, 10. general environment and 11. football environment. Through different stages of research, we have been using in total more than 160 different variables to find the final standardized algorithm. Also, we have been using data about single variables from 5 years before and for some variables even 10 years before.

We have been analysing 227 clubs from 36 European leagues. 31 leagues are from the 1st national tier and 5 leagues are from the 2nd national tier:

1ESP – La Liga
2ESP – La Liga 2
3ENG – Premier league
4ENG – Championship
5GER – Bundesliga
6GER – 2. Bundesliga
7FRA – Ligue 1
8FRA – Ligue 2
9ITA – Serie A
10ITA – Serie B
11TUR
12POR
13NED
14SCO
15SVI
16ROU
17UKR
18BEL
19RUS
20GRE
21POL
22SER
23CRO
24AUT
25HUN
26CZE
27DEN
28NOR
29SWE

In the analysis were included all clubs from the Big 5 leagues and the best clubs from other listed leagues. More clubs per league were selected from the following leagues: Netherlands, Portugal, Turkey, Belgium, English Championship and Russia (*this year’s results are not affected by the war in Ukraine for Ukraine and Russian clubs).

Of all those clubs, the TOP 100 clubs by enterprise value are:

 ClubStateEV – mil€
1Real MadridSPA3139
2FC BarcelonaSPA3019
3Manchester UnitedENG2867
4Liverpool FCENG2847
5Bayern MunichGER2727
6Manchester CityENG2540
7Chelsea FCENG2299
8Paris Saint-GermainFRA2053
9Tottenham HotspurENG1761
10Arsenal FCENG1623
11Juventus FCITA1558
12Borussia DortmundGER1347
13Atlético de MadridSPA1116
14Inter MilanITA1052
15AC MilanITA766
16Leicester CityENG670
17SSC NapoliITA655
18Everton FCENG633
19RB LeipzigGER625
20Bayer 04 LeverkusenGER582
21AS RomaITA544
22Olympique LyonFRA542
23AFC Ajax AmsterdamNED469
24AS MonacoFRA451
25Valencia CFSPA431
26FC PortoPOR401
27SL BenficaPOR377
28Real SociedadSPA356
29Olympique MarseilleFRA350
30Wolverhampton WanderersENG346
31Atalanta BCITA344
32Aston VillaENG341
33SS LazioITA326
34Borussia MönchengladbachGER312
35Galatasaray A.S.TUR309
36Southampton FCENG305
37Sevilla FCSPA292
38TSG 1899 HoffenheimGER274
39Sporting CPPOR274
40ACF FiorentinaITA272
41West Ham UnitedENG259
42Eintracht FrankfurtGER244
43Crystal PalaceENG242
44Fenerbahce SKTUR241
45Newcastle UnitedENG239
46Villarreal CFSPA237
47VfL WolfsburgGER233
48LOSC LilleFRA232
49PSV EindhovenNED226
50Athletic BilbaoSPA222
51FC Schalke 04GER221
52Red Bull SalzburgAUT207
53AFC BournemouthENG204
54OGC NiceFRA202
55Real Betis BalompiéSPA198
56Shakthar DonetskUKR184
57FC ZenitRUS178
58Torino FCITA177
59Brighton & Hove AlbionENG174
60Stade Rennais FCFRA174
61US SassuoloITA168
62Fulham FCENG168
63Hertha BSCGER161
64Watford FCENG155
65Club Brugge KV BEL149
66PFC CSKA MoskvaRUS141
67FC Girondins BordeauxFRA140
68Getafe CFSPA139
69Celtic FCSCO136
70FC Spartak MoskvaRUS136
71RSC AnderlechtBEL135
72VfB StuttgartGER134
73Burnley FCENG133
74Celta de VigoSPA132
75SV Werder BremenGER130
76Feyenoord RotterdamNED129
77SC BragaPOR125
78Udinese CalcioITA123
79AS Saint-ÉtienneFRA122
80GNK Dinamo ZagrebCRO122
811.FSV Mainz 05GER120
82Cagliari CalcioITA119
83West Bromwich AlbionENG119
84Dynamo Kyiv UKR118
85Bologna FC 1909ITA118
86SC FreiburgGER116
87Leeds UnitedENG116
88UC SampdoriaITA111
89Stoke cityENG108
90RCD Espanyol BarcelonaSPA106
91Olympiacos PiraeusGRE106
92KRC Genk BEL104
93FC NantesFRA103
94Swansea cityENG102
95AZ AlkmaarNED101
96Norwich CityENG101
97Montpellier HSCFRA99
98TrabzonsporTUR97
99Lokomotiv Moscow RUS96
100FC Basel 1893SVI93
TOTAL50 414 mil€

The total value of TOP 100 clubs is 50,414 bil. € coming from 18 European leagues with two leagues from the 2nd national tier (English Championship and German 2. Bundesliga):

  Tot value clubs-TOP100% of league clubs-TOP100Average value-TOP100
1ENG – Premier league1834995%882
2SPA938660%469
3GER – Bundesliga722667%382
4ITA633270%317
5FRA446855%223
6POR117722%65
7NED92522%51
8ENG – Championship70021%29
9TUR64715%32
10RUS55125%34
11BEL38717%22
12GER – 2. Bundesliga35111%20
13UKR30213%19
14AUT2078%17
15SCO1368%11
16CRO12210%12
17GRE1067%8
18SUI9310%9

In the above table, values of clubs from a single league were summarized to identify differences between leagues in TOP 100 enterprise value. The highest enterprise value of clubs from a single league in TOP100 is having English Premier league (18349mil€) followed by Spain La Liga (9386mil€), German Bundesliga (7726mil€), Italy Serie A (6332mil€) and French Ligue 1 (4468mil€). English Premier league is pointed out with almost double as value as Spain La Liga. Further on, English Championship is the 8th league (700mil€) in Europe by the value of clubs in TOP100 (German 2. Bundesliga is the 12th league by value (351mil€) of clubs from one league in TOP100).

If we look at the column “% of league clubs-TOP100” we will see again that the English Premier league pointed out, that 95% of clubs from the league, or 19 (Brentford is out) are part of TOP100, followed by Italy Serie A (70%), German Bundesliga (67%), Spain La Liga (60%) and France Ligue 1 (55%).

The column “Average value-TOP100” is the value from all clubs from one league in TOP 100 divided by the number of clubs in the observed league. Leagues with a higher number of clubs will have less average if they have the same number of clubs in the TOP 100 as leagues with fewer clubs in it. Again, the English Premier League is having the highest average (882mil€) followed by Spain’s La Liga (469mil€), German Bundesliga (382mil€), Italian Serie A (317mil€), and France Ligue 1 (223mil€).

Those two columns (“% of league clubs-TOP100”, and “Average value-TOP100”) might indicate the concentration of overall competition and quality of the observed league. A higher percent of league clubs and average might mean higher quality and competition in the league.

If we compare results from the MoF EV list and results from KPMGs spin-off Football Benchmark, the biggest positive differences are with the following clubs (MoF EV – KPMG EV):

 ClubMoF-KPMG (EV)
1Liverpool FC291
2FC Barcelona205
3AC Milan188
4SSC Napoli172
5Leicester City FC144
6AS Roma131

It is noticeable that generally Italian clubs are generally higher valued in the Mof EV algorithm than in KPMG’s spin-off, Football Benchmark with the highest percent of the difference in EV from KPMGs  (SSC Napoli 36%, AC Milan 32%, and AS Roma 32%).

Biggest negative differences (MoF EV – KPMG EV):

 ClubMoF-KPMG (EV)
1Tottenham Hotspur FC-151
2Atletico de Madrid-118
3Atalanta BC-110
4Sevilla FC-98
5Paris-Saint Germain FC-79
6Villareal CF-66

The list of 32 clubs from Football Benchmark is different from Mof EV list. Clubs which are on Mof EV list but not on Football Benchmark one, are RB Leipzig, Bayer 04 Leverkusen, AS Monaco, Real Sociedad, Olympique Marseille and Wolverhampton Wanderers.

The characteristic of this method is that at any moment value of any club in Europe can be calculated based on publicly available data. Although results were tested with KPMG’s spin-off Football Benchmark and sales which really happened, using financial reports for another step of testing the model would be beneficial.

Model by itself reveals what from reality influences most on the enterprise value of the clubs and as such, they can be used for setting relevant and measurable goals for the top management of the club, and for setting KPIs for the top management of the clubs.

Although enterprise value is important when one is investing in the club, estimating the potential of an individual club and the gap which it can fill is of big importance as well. It depends not just on clubs’ inner potential (financial, human resources, community, infrastructure …) but also on football’s external environment and general environment and based on other research results that are interesting in combination with EV research.

Next research…

The quality of human capital in club management is interesting as well as sports staff especially. So, on my list of next research is a calculation of standardized model of quality of management of clubs and standardized model of quality of sport management of the club. Besides that, two research on the “to do” list is research about brand and research on talents.

If you have any comments, we would be grateful to talk about this, what do you think about the possibility of this kind of calculations of enterprise value, what do you think about results and do you have maybe any idea about improving this research (combining with financial reports would, of course, be very useful but here is an idea to use date, not from financial research) and about further research. Special thanks go to Nikica Krnić, Konstantin Kornakov and Josip Korda.

Check out this article on LinkedIn:

Read More
WHAT IS ESSENTIAL FOR RUNNING A SUCCESSFUL ACADEMY?

As I have been analyzing in last articles, most important of 12 quality areas are Cognitive care, Human capital, Productivity and Talent identification.
You can find articles on following links:
1.    How we perceive the physical and „decision making“ characteristics of players, how we can measure them and develop them? Click to read more.
2.    About what is “produced” in the academies and what we could “produce” as well. STAVITI LINK NA WEBU_BLOG GDJE SE NALAZI 3.    What do we about „digital life“ of kids in an academy, do we do anything about it and what could we do. Click to read more.

4.    Relation between academies and player agents. Click to read more.
5.    What academies across Europe do most often and what do they the least? Click to read more.
 
Most important quality areas were detected over working processes used on daily basis in youth academies. You will find all this quality areas in most used, least used, most correlated working process and in analysis of interviews.


Those working processes are separated in 17 quality areas. Among them most important are Youth academy – players, Youth academy – Coaches and Youth academy – Staff.


Finally, in development of youth academy, among 17 working areas and 12 quality areas, focus should be on coaches, staff, and players from one side and human capital, cognitive care, productivity and TID from the other side. Finally, ingredients are club buy-in and strategic importance for academy. That’s the path to follow to get to maximum of your potentials. Having this you will develop other quality and working areas as well!

Read More

Recent Posts

  • TOP 100 European football clubs by enterprise value
  • Hamstring injuries in professional football: Summary of research that tracked causes through 21 seasons.
  • Example of scouting report
  • AnaLysis of City, Arsenal and Liverpool
  • Difference between Arsenal, Liverpool and Manchester city on the pitch in the 2021/2022 season through the statistics.

Recent Comments

No comments to show.

Archives

  • March 2025
  • February 2024
  • April 2023
  • December 2022
  • July 2022

Categories

  • Club managment
  • Footbal sport methodologies
  • Football specific services
  • Football sport policy
  • Strategy

Posts pagination

1 2 »

©2022 MANAGEMENT OF FOOTBALL