April 2023
AnaLysis of City, Arsenal and Liverpool
1. Manchester City
Manchester City is a team which bases its game on a set defence and many passes before the end of the action. Over the years, their coach Pep Guardiola has created a game structure in attack whose primary focus is the prevention of the opponent’s counterattacks. With this objective, the role of full back players, often playing in half spaces at different heights and who are complemented by attacking midfielders in the occupation of these spaces, is crucial.In general, City have somewhat passive movements of the full backs in the half spaces after leading the ball to the stopper, and sometimes in situations when the ball is in front of them, most often with a winger.Also, the movements of the full back players in the wing position on the open ball from the central zones can be much more active, where the side players very cautiously conquer the field in depth and thus prevent progressive passes that throw out many opposing players. Such problems are especially visible when stoppers (Stones and Ake) play in the position of the full backs. Such attacks, when they end with a loose ball, open larger spaces between the back and midfield lines because the wing players stand too deep, thus opening spaces between the lines for a second or two before they can close them. It is especially important to emphasize that these problems are much smaller when City uses the overload tactic (positioning more players on one side of the field) because they very well set the opponent players on desired position and then use quick side changes, which to a good extent cancels the above problems.As their game is based on controlling the game with the ball, the role of the last passes in the prevention of the opponent’s counterattacks is important. Many final City passes end up with balls in the air – usually parabolic balls from half space with good control of the zone under the ball with five players, most often in a 2-3 structure. Passes in the air make it difficult for the opponent to open counters because they are much more difficult to control and play accurately.As City narrows the field in attacking the opponent’s goal, they have many shots that end up in the opponent’s block, and therefore the matches in which they use the width of the field better and get more open shots are a good indicator of their victories.Another important factor in choosing to play the opponent’s system is the choice of passing and moving into the middle or wing zone. City occupies the central zones better and overloads them, than it does in the wing zones. Their system is primed to control the middle of the pitch and if they are allowed any space in the central zone they will use it very well, which cannot be said for all situations on the wing.The most effective actions in the wing positions are the dribbles towards the centre of the field by the wing players, to which they have very good movements of the players in front of the ball (further wing, 8 and striker). They do most of the dribbling in the back third with wings and 8s, especially in second attacks (after winning loose or nobody’s ball). The entire structure of the game is designed to prevent and allow frontline players to overwork, so it’s no surprise that dribbling percentage is such a good predictor of their success.City is a team that plays pressing for a large part of the game and tries to take the ball away from the opponent in the shortest possible interval. The biggest problems they have are due to the large number of pressing actions on the opponent’s goalkeeper, where they lose their compactness and because of this, often the second ball after the opponent’s long ball. In this way, the opponent enters the final third and creates opportunities and breaks – usually corners.In general, they are too vertical in pressing and it would be good for them to wait a little longer for pressing triggers (the moment when they can direct the opponent’s attack), because the lines below could close the spaces more compactly.They have the biggest problems with long balls and overloading of the back line. The back line tries to defend such attacks with a high line and only a small mistake in closing is enough to open a deep pass for the opponent. They react especially poorly to the overload in the middle of the field in the jump, where their side players remain isolated in the game 1vs1.Another potential disadvantage is the control of long balls, which they try to keep in their possession in a risky way (passing and dribbling) and in this way they provide opportunities for the opponents.The same problem is also reflected in breaks, and the most problems are created by teams that attack all free kicks within 60 m from their goal with many players. The constant attempts to keep the back line high and the weaker pressing reset after the second ball leaves them exposed against this type of action.
2. Liverpool
Liverpool is a team that bases its game much more on the control of transitions, long balls, and other balls.In their attack, the emphasis is on parabolic deep balls behind the back line, crosses from wing positions and half space, quick short combinations in central zones and diagonal balls.They especially use diagonal balls towards the left side to Roberston, for whom the winger opens space in the wing position with his deep movements, and there is almost no game in which they are offensively efficient, without that segment of the game functioning at a high level.Their attacking structure is still not as clean as City’s. They rely more on the dynamics of actions and excellent counter pressing.The largest number of players are brought into the 16m when the opponent allows them depth to the side players, and then the occupation of the 16m follows with four to five players while the players below control the bounced balls very well after the centre kick.Liverpool creates the most successful attacks after the first and second lost ball, by trying to play the final pass in the inferiority of two to three players. When it seems that the lines below will not compactly accompany such an attack, there is a strong movement towards the ball and a counter-pressing that seeks to take the ball through the duel, cutting the passing lines and taking advantage of the direction of the opponent’s attacks. Since their game is based so much on that segment, the number of won defensive duels is crucial in this phase of the game as well.Transitions work in the same way, where they like to play deep on two or three players in the front line and if the deep ball does not go through, they have an excellent movement of the formation in front of the ball, which provides them with the possibility of counter pressing.It is interesting that they use the same principle with their own and the opponent’s long balls.The only situations when they are not so vertical is when there is an open diagonal ball towards the far side, where they create an excellent surplus in front of the ball with the side players and attack the opponent’s penalty area beautifully in waves.Due to the aforementioned style of play, it is clear that aggressive control of the lost ball plays a key role for them in all phases of the game, and because of this, yellow cards are a good predictor of their results = when the prevention structure moves well under the ball, they win duels and take balls cleanly, and when they are late they fall out and receive an increased number of yellow cards.It should be emphasized that in pressing and counter-pressing actions, they have a great focus on moving towards the ball, and when the situation is played out, they compensate with extremely good descent and defence of the penalty area. The back pressing of the attacking and midfield lines after they have been played is perhaps the best in the world and it is very difficult to play back passes against them when the opposing team enters the final third.
3. Arsenal
When we analyse Arsenal, we must divide the 2021/22 season into two parts. The first part of the season was very bad, and they were looking for a style of play that suits them. In the first 10 rounds, they were so bad that they were close to the relegation zone.From the 4-2-3-1 system, the team usually had a very weak occupation of the central zones, a lack of width due to premature entry of the wings towards the middle, very high positioned full backs who opened spaces for the counter and risky combinations in the central zones.In the defensive phase, the team had weak pressure on the ball, poorly controlled the far side and especially poorly defended the half spaces because of the back line that passively guarded the goal and because of which the wings and the near midfielders closed those spaces in an undefined and bad way.Because of all the above-mentioned characteristics and transitions, they were disconnected and isolated, and everything pointed to the dismissal of coach Arteta.From the period around the New Year, they found the game in a 4-3-3 formation and since then they have been at the very top of the league in terms of points won. They started playing with the full backs set up in half space, false nine and high 8s as the general setting of the game. The game began to resemble that of City where Arteta worked as an assistant coach before taking over at Arsenal.The main difference is that in attack Arsenal is more focused on playing the wing zones with triangles on the sides that form a side-8 and the wing, and more attack turns through the near midfielder. On both wings, they have wings on opposite feet and in the new system of the game they can reach the wings much more easily, who dribble towards the middle and create excess and play diagonal passing lines in front of them.The moment they started playing that way, they started to control the middle of the field and win many balls from counter pressing. From that moment on, the number of defensive duels won, became a great predictor of their success.A segment that has also taken them to a whole new level is moving towards long balls. Before, they played long balls against the settled defence and counters against isolated players of the offensive line, while now they even anticipate the zones of the second ball with players under the ball, which significantly increased the number of offensive duels won.They use many crosses from half space after the return ball, so that both, they, and City lack width in the attacking phase, which is why they have an increased number of blocked shots because they shoot at the goal in situations when the opponent is compact in width in front of their goal.They have taken the pressing game to a completely new level, they manage to initiate pressing with strikers, wingers and 8s across different widths of the pitch, which was never the case before. In this way, they significantly increased the number of balls won in the opponent’s half, along with, of course, the counter-pressing phase, which we explained in the previous part of the text. On the other hand, they showed problems in pressing actions against teams that play with five players in the back line, where they either opened too much space in the intermediate lines or became too passive and focused on compactly defending their goal without pressing the ball.As their game became more connected, their counters became much better and there they introduced a segment that Liverpool has, which is the arrival of the full backs from the second plan with overlapping and underlapping, but in addition they added the arrival of 8 in the central areas of the field in the end.However, when they have less time on the ball per won ball, they still know how to play too vertically and do not use the third man enough to play off the opponent’s pressure towards the far side.The phase of the game that they brought to an exceptional level is the attacking throw in, where they developed excellent actions to open up the far side and created a large number of entries into the final third in that way.
Difference between Arsenal, Liverpool and Manchester city on the pitch in the 2021/2022 season through the statistics.
Difference between Arsenal, Liverpool and Manchester city on the pitch in the 2021/2022 season through the statistics.
After analysing nine leagues in Europe (TOP5+Austria, Belgium, Croatia, and Poland) (https://www.linkedin.com/pulse/do-leagues-generally-differ-between-themselves-pitch-slaven-marasovi%C4%87) based on a survey conducted on LinkedIn I have analysed three clubs from Premier League in the season 2021/22: Manchester City, Liverpool and Arsenal. So, how do these three clubs differ on the pitch based on the statistical data and analysis? Could you read the playing style from it? Their strength and weaknesses. What could be the benefits of this kind of analysis? Could clubs use it to improve their strengths and reduce their liabilities or to recognize it in opponents’ games? Could players use it for identifying the best clubs for their signings? Maybe it could be interesting for journalists to analyse matches…?
To answer those questions, I have used four criteriums:
1. What are the key factors to create a chance in the individual club?
2. What are the key factors on the pitch for scoring a goal in the individual club?
3. What are the key factors on the pitch for not losing the game in the individual club?
4. What are the key factors on the pitch for winning a match in an individual club?
To describe those four criteriums I have used:
1. frequency (what is most used in each league),
2. statistical correlation and
3. statistical regression.
As we stated in the prior article, the frequency of 104 observed aspects of the game will tell us which aspect of the match is happening the most. That will not help us understand how to reach each of the criteriums.
On the opposite, the statistical correlation will tell us what correlates with each of the criteriums and help us start understanding each of criteriums per country. So, more interesting will be those aspects of the game which have a stronger correlation with each of the criterium.
Regression models will indicate us what is specific for reaching each of criteriums per each country and help us better understand each of criteriums. For the best understanding of each country will be summarized correlations and regression models as prepared for interpretation.
If you want to read more about regression models just go on the above-mentioned article https://www.linkedin.com/pulse/do-leagues-generally-differ-between-themselves-pitch-slaven-marasovi%C4%87 .
I will provide you insights and interpretation will live for you. Also, I can announce the interpretation of this data by an expert @Goran Rosanda, so, stay tuned.
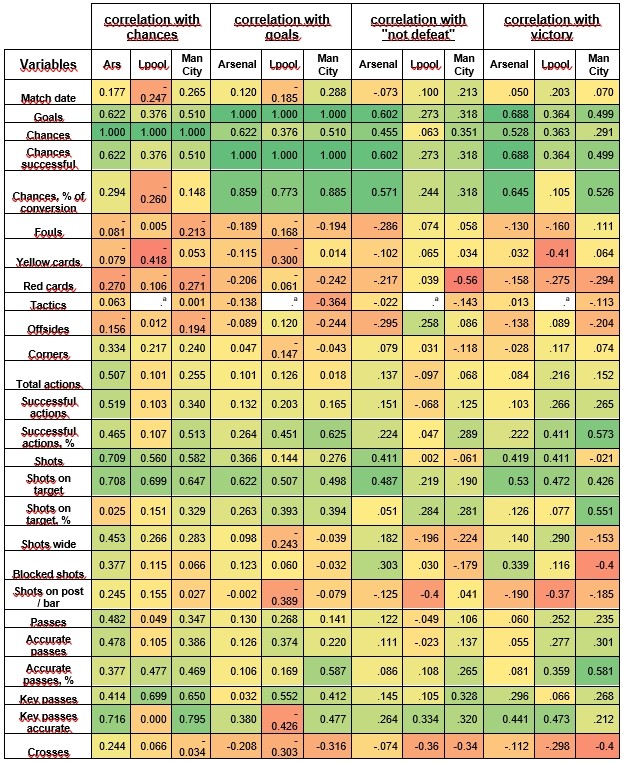
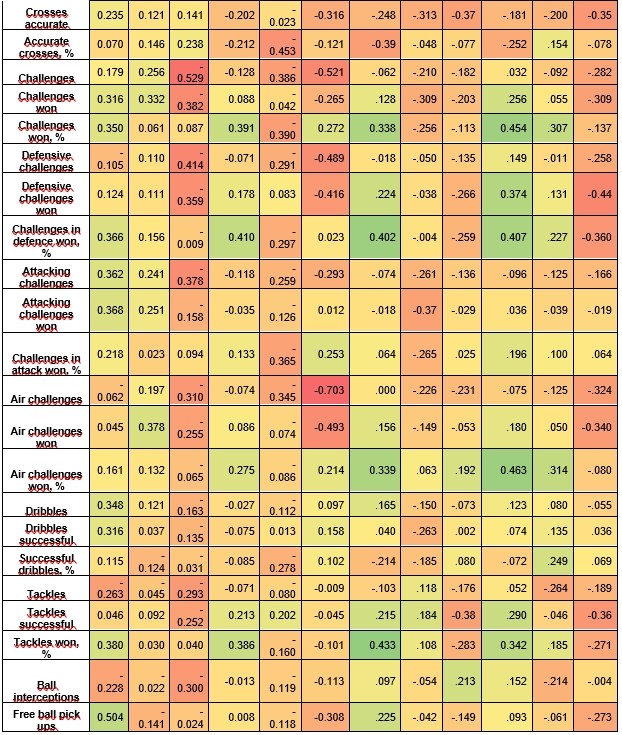
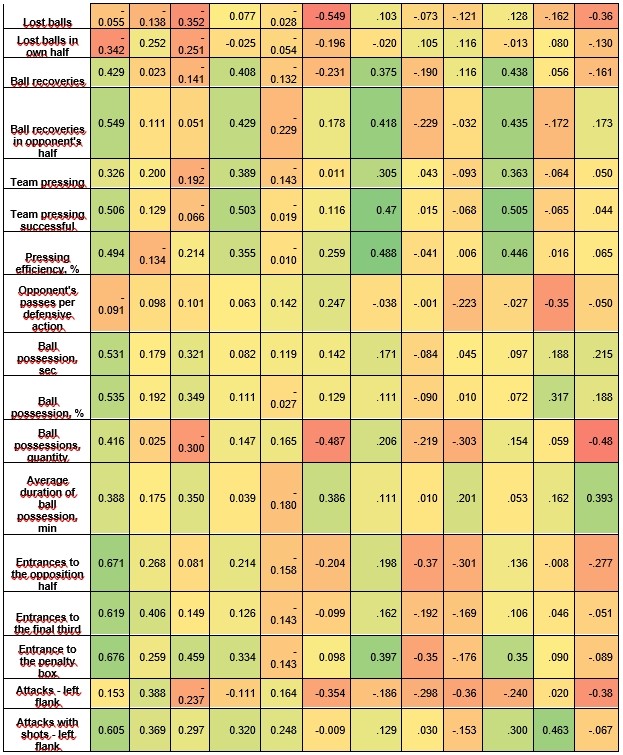
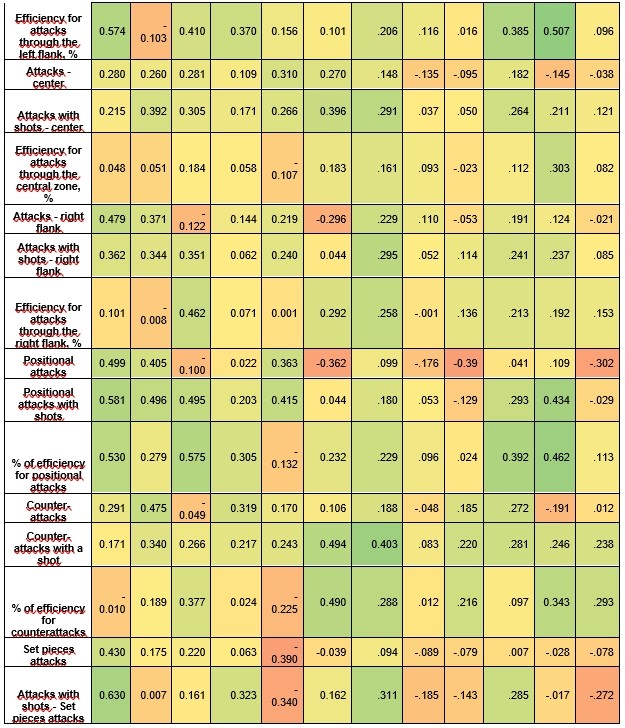
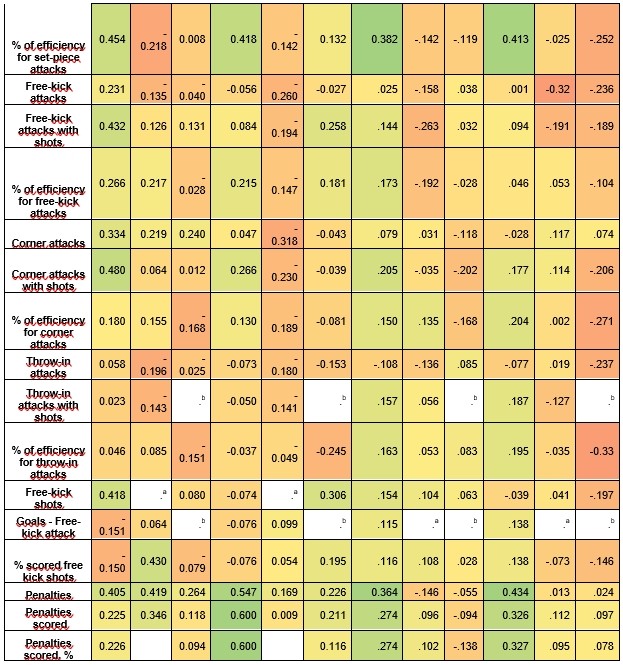
In the following heatmap of correlations of different aspects of the game are presented. So, let’s start with correlations between “creating a chance”, “scoring a goal”, “not losing a match” and “winning a match” and different aspects of the game per each club. It was very interesting to go through each correlation and notice the differences, so I advise you, if you find this topic interesting, to go through it. That’s why I will provide all correlations to you (without xG related). Each aspect of the game is interesting and if you combined one aspect of the game with another you can have interesting conclusions. For the practical side and size of this text, I will focus just on the obvious differences in the game between the clubs.
The yellow card’s most negative influence on the Liverpool game and correlation is much (negative) higher than for the other two clubs, while the red card’s most negative influence has on the Manchester City game. Manchester City is having the most negative correlation with offsides (have a look at Liverpool in the “not defeat” category”). The percentage of successful actions is most important for Manchester City, while the number of shots and shots on target is for Arsenal. Again, per cent of shots on target is having the most positive influence on Manchester City’s game. Further on, blocked shots have a negative influence on the Manchester City game. There is an interesting difference between Liverpool and the other two clubs relating to key passes accurate. While Arsenal and Manchester City have an extremely high positive correlation with creating chance (+0.7), Liverpool does not have any correlation at all (0.0). For goals, Manchester City and Arsenal are having very positive correlation (0.4) while Liverpool is having very negative (-0.4). In “not losing the game” and “winning the match” Liverpool is having most positive correlation.
Per cent of accurate passes is most important for Manchester City games, and crosses, challenges and challenges won are having the most negative influence on the same club. On the other side per cent of the challenges won is having a positive influence on Arsenal’s game. Also, defensive challenges and defensive challenges won are having a mostly negative influence on Manchester City games. This does not mean that winning challenges in defence is bad but keeping Manchester City defending and under-pressing is negatively influencing their performance. It is not easy to do, obviously, but that’s the description of how they have been not winning and losing games.
Manchester City also does not like football “in the air” since they are having very different correlation in air challenges and air challenges won than Arsenal and Liverpool. In Manchester City, it is very negative. On the other side, Arsenal is having a positive influence in winning air challenges with victory and not losing the match. Successful tackles are having the most negative influence on the Manchester City game again as same as lost balls. Ball recoveries are having a most positive influence on Arsenal’s game, same as ball recoveries in the opponent’s half, team pressing, team pressing successfully and per cent of pressing efficiency. Ball possession quantity is having the most negative influence on the Manchester City game while the average duration of ball possession is having the most positive influence on the Manchester City game. This might indicate that in games in which Manchester City had a lot of possession whit small average possession of the ball possession and with a lot of interruption in actions from the opposite team. Attacks on the left flank are most negative for Manchester City and most positive for Liverpool. The positional attack is the most negative for the Manchester City game the same as per cent of efficiency of throw-in actions. Liverpool “does not like” free kicks with shots because it has a negative influence on their game. Penalties have a positive influence on Arsenal’s game.
Table 1.: Heatmap of correlations between chances and different aspects of game per each club
The following models will indicate to us what is specific for reaching each of the criteriums and for each club. In each of the tables for regression models, green will be marked aspects of the game which have a statistically positive significant correlation, red will be marked aspects of the game which have a statistically negative significant correlation and those aspects of the game which don’t have any statistically significant correlation will not be marked.
It is interesting that some clubs’ models have fewer independent variables and in some more. It might be that in clubs with fewer variables, independent variables are more influential on dependent variables than in models with more independent variables in the model. It means that experts would have fewer variables to focus on if they would use this model to improve chances, and goals, not being defeated or winning. Also seeing variables in chances, one can see what each club is focused on. It might be interesting for planning matches or for opponent teams playing games against such clubs.
Regression models for “create a chance”
Adjusted R square is very strong (very high) for the “create chance” criterium, for all clubs. It goes from 0,808 for Liverpool, over 0.877 for Manchester City till 0.926 for Arsenal. Only key passes – accurate and penalties are present in all models.
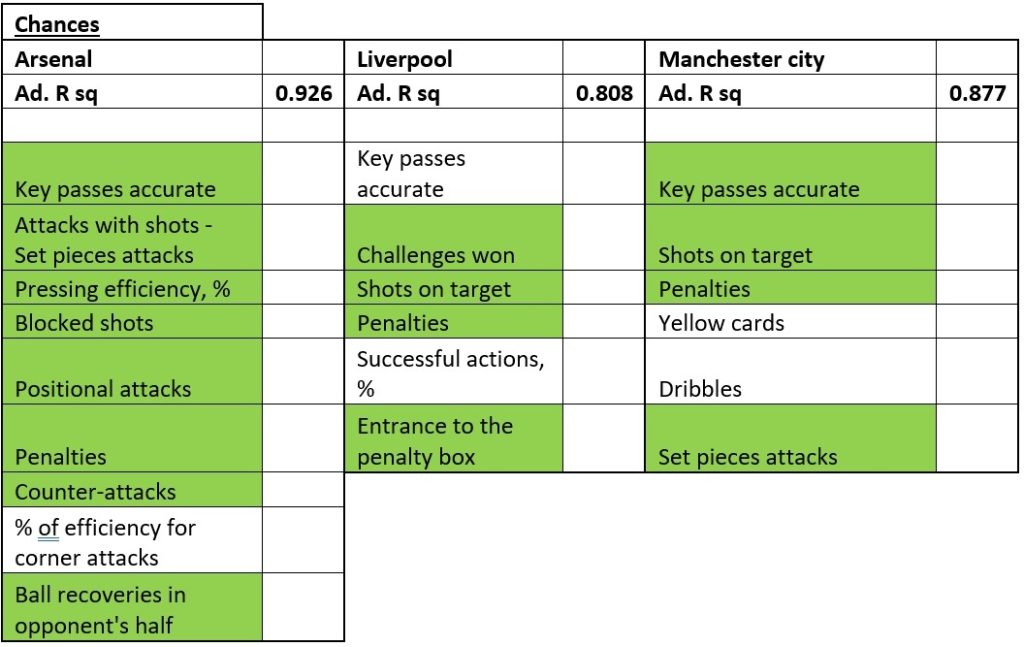
For creating chances for Arsenal, it is important to have efficient pressing, ball recoveries in the opponent’s half, counter attacks among others. Arsenal has attacks with shots – set pieces attacks while Liverpool has entrance to the penalty box with shots on target and Manchester City has set pieces attacks, dribbles, key passes accurate and shots on target. It might be observed from the perspective of distance from goal and from the perspective of how they “materialize” chances. It seems that Liverpool and Manchester City are more similar than Arsenal is with these two clubs. It could be argued that the difference between Liverpool and Manchester City is by “principle” how they “approach” the chance. It might be that Liverpool is reaching the penalty box by actions before the shot while Manchester City also use dribbles before chance not just from the penalty box.
Regression models for “score a goal”
To score a goal is more difficult to predict than to make a chance. Still, the adjusted R square is strong above 0,600. On the other side, in models for “goals” is much more variables with a negative significant Pearson correlation. Have in mind to see those variables as those which should be reduced in the potential game plan. There is no single variable which is common for all clubs.
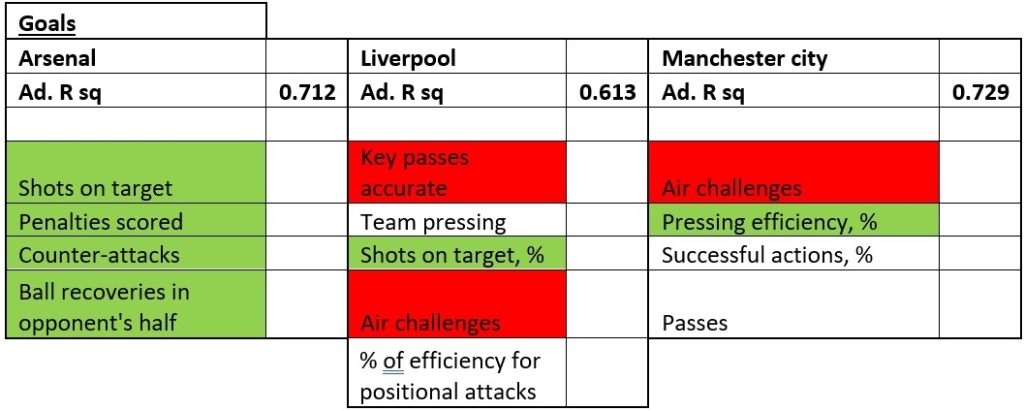
It is interesting to see that in this criteria, Arsenal is also having more “distance” from the other two clubs. While Arsenal is scoring from a more “defensive” position using ball recoveries in the opponent’s half and counter-attacks in Liverpool and Manchester City there is no such case. Both Liverpool and Manchester City are more “pressing oriented” and focused on the “ground”, avoiding the ball in the air.
Regression models for “not defeat”
Not to be defeated is the most difficult to predict of all four observed variables and it is especially radical in Liverpool’s case. Adjusted R square is very weak, just above 0,100. Models for “not defeat” have the least variables per model and again, especially for Liverpool. There is no single variable present in all models.
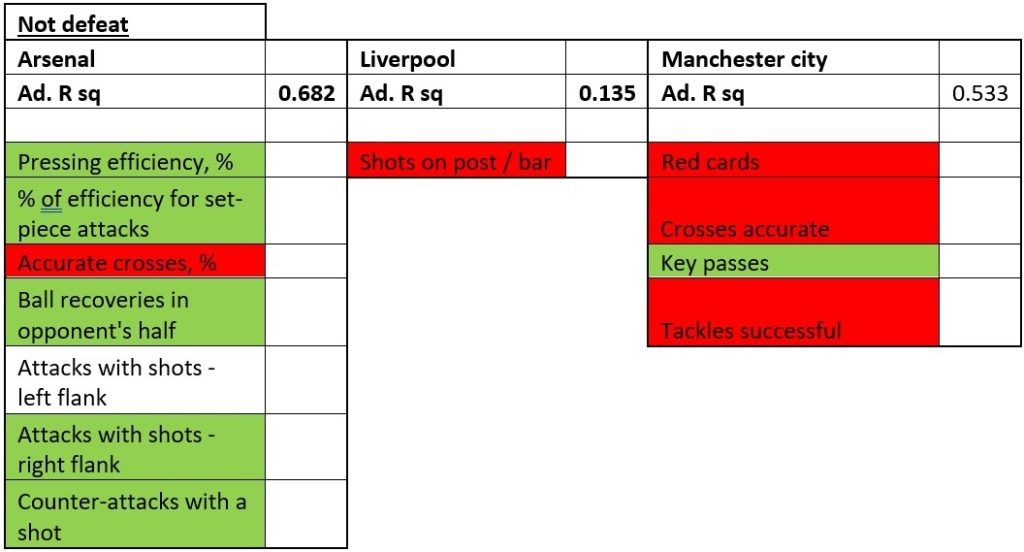
For Arsenal model consists of similar variables while the situation is changed in Liverpool and Manchester City case. In Liverpool’s case, there is just one variable, shots on post/bar which should be reduced. It might indicate that in a number of matches which they have lost, they had shot in post/bar. There was no single other variable which was significant for the model for not losing the match. Manchester City is very sensitive on red cards (the other two clubs are not), tackles and crosses and Manchester should reduce those variables in the game.
Regression models for victory
Although all of the models have their purpose in planning the game, and it might be that is best to observe them all in planning, victory might be the most interesting because victory brings the most to the team, players, coach, and the club. Adjusted R square is between moderate and strong, from 0,598 to 0,673. There is no single variable which is present in all models
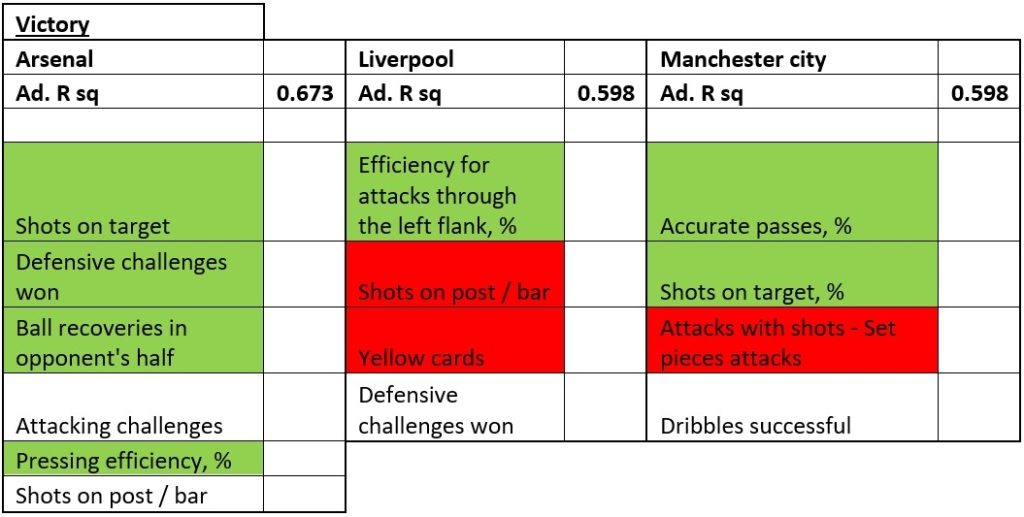
There is a difference between the model in this criterion and another in the Arsenal case. In all other criteria, counterattacks were part of the model, while the “victory” model is not. On the other hand, there are two new variables in the model, per cent of pressing efficiency and defensive challenges won. It might be argued that when Arsenal has successful pressing and defensive challenges won that it indicates a victory for them. In Liverpool’s case, per cent of efficiency of attacks through the left flank is very important. On the other hand, if they are “forced” on yellow cards it indicates not winning the match. Obviously, a lot of shots on post/bar. And while the defence won the challenges, chances for victory are better. In Manchester City’s case, if they succeed in not being “interrupted” you might lose the match against them. If they succeed to dribble their way in and have efficiency in shooting the target be aware.
Compared to the last, what changed in Arsenal, Manchester City and Liverpool this season?
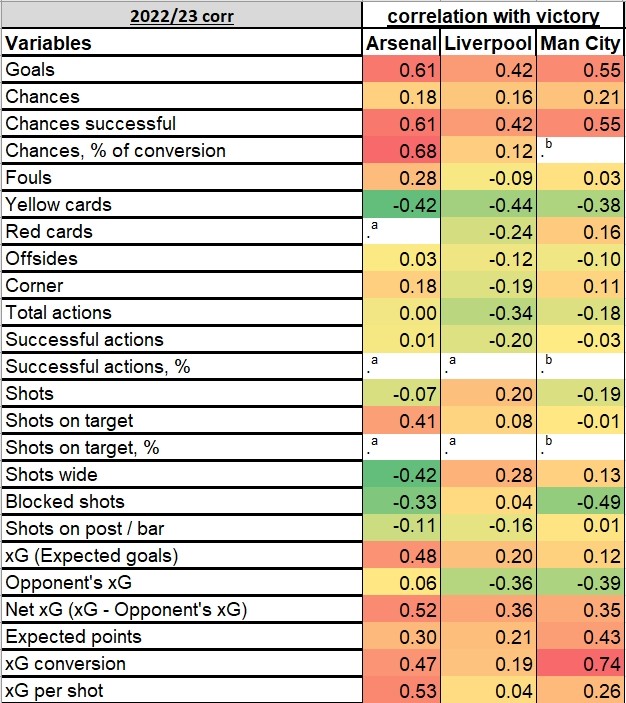
This analysis was made on the first 17 rounds of the Premier league. Besides this season, the highest changes are identified and presented. Also, the biggest changes which have significant statistical correlation this season is also given. Analysis was made based on the criterium “victory”. It means that all presented data all in relation to victory. If it is positive, it means that when the frequency is higher, victory is more likely to happen (e.g., more shots more possibility for victory), and vice versa (e.g., more lost balls, less possibility for victory). It is interesting to notice that there are not just minor differences in correlations between clubs. Also, it is very indicative to see where the highest changes in correlation with victory happened this season compared to last.
Statistical correlation goes from -1 to +1. -1 means that if something happens, the other variable definitely will not happen, while +1 implies that if something happens, the other analysed variable will definitely happen.

Correlation in season 2022/23
Arsenal’s „shots on target“ have a moderate correlation with victory in opposition to two others clubs which means that they are more precise or have better-prepared situations for shooting on goal or better decision–making in execution. On the other side shots wide have a negative correlation with victory for Arsenal while Liverpool has an almost moderate positive correlation. It might mean that Liverpool achieves victory through the high intensity of attacks; on a higher amount of attacks with shots comes a higher amount of victories. On the other side, very moderate, near-strong negative correlation Manchester City has with blocked shots. Liverpool doesn’t have it negatively at all, but Arsenal does have it, almost weaker than Manchester City.
here is an indicative difference between Arsenal on one side and Liverpool and Manchester City on the other side in crosses. Arsenal has a weak but positive correlation while Arsenal and Manchester City have between weak and moderate and negative correlation.
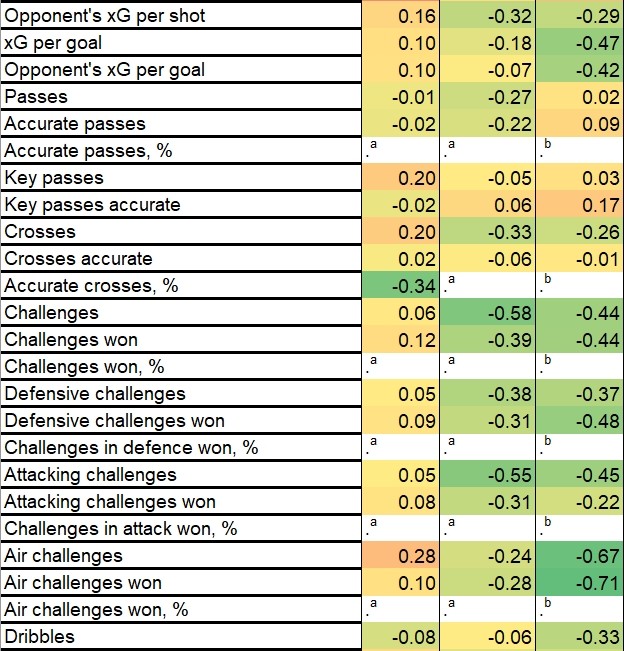
In all types of challenges, Arsenal has no stronger significant correlation with victory, but Manchester City and Liverpool do. It means that challenges do not influence the victory of Arsenal but do influence negatively the victories of Manchester City and Liverpool. This is very important in understanding the game styles of those three clubs. It is especially noticeable in air challenges where Arsenal has a weak to moderate positive correlation with the victory while Liverpool and especially Manchester City, have a very strong negative correlation.
Ball recoveries and ball interceptions have a positive weak correlation with victory in Arsenal’s case but don’t have for others.
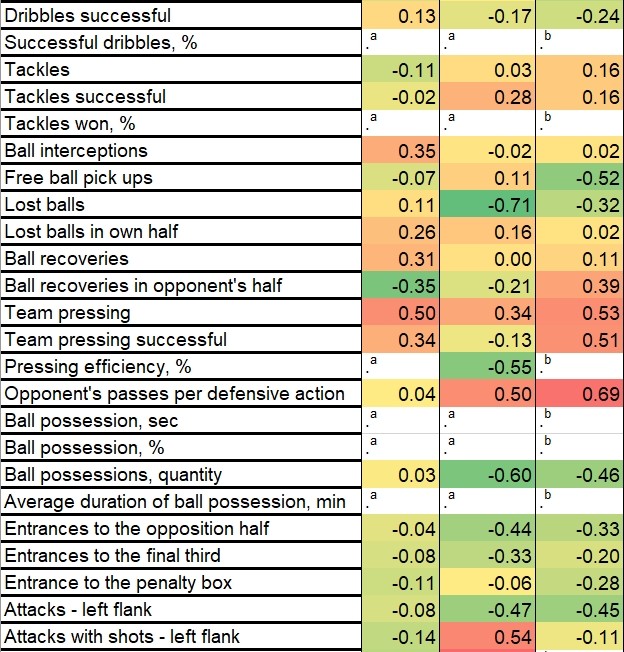
Liverpool has a strong – very strong negative correlation between lost balls and victory. Manchester City has weak negative and Arsenal doesn’t have a significant correlation at all between lost balls and victory. Obviously, Arsenal had a better response on lost balls in the first 17 rounds, while Liverpool has the worst and even generally poor reaction on lost balls when we are analysing the influence on victory.
An interesting difference between Arsenal and Manchester City is that Arsenal has a weak – moderate negative correlation with ball recoveries in the opponent’s half while Manchester City has a moderate positive correlation with victory. So, for Manchester City is, generally, very important to play on the opposite side of the field while Arsenal does not respond positively in such a situation.
All teams have a similar moderate positive correlation between team pressing and victory, with Manchester City having the strongest and Liverpool the weakest.
One more interesting difference between Arsenal and the other two teams is in the opponent’s passes per defensive action. Arsenal doesn’t have a significant correlation while Manchester City and Liverpool do have a moderate – strong positive correlation. It means they actually do more opponent’s passes per defensive action while for Arsenal is irrelevant. Manchester City prefers the right flank while Arsenal is balanced with a little more flavour on both flanks than in the centre.
Liverpool does like the left flank in case they succeed to have a shot in such an action. If not, it might be dangerous for them. Also, they like attacks through the centre.
Neither of the clubs has a positive significant influence on positional attacks with victory. Obviously, they need to use some other mechanisms to win a match. Even more, all clubs have a significant negative correlation with victory, Arsenal is weak, and Manchester City and Liverpool strong negative correlation between positional attacks and victory.
All teams, if they succeed to shoot have a positive significant correlation between counterattacks with victory in which Arsenal have a moderate correlation, the best of all three teams, while Liverpool and finally Manchester City, have a weak positive correlation.
Liverpool like free-kick attacks with shots but doesn’t like throw-ins. For the other two teams, there is no significant correlation.
It seems that there is a positive, weak, but significant correlation between penalties and victories in the Manchester City case.
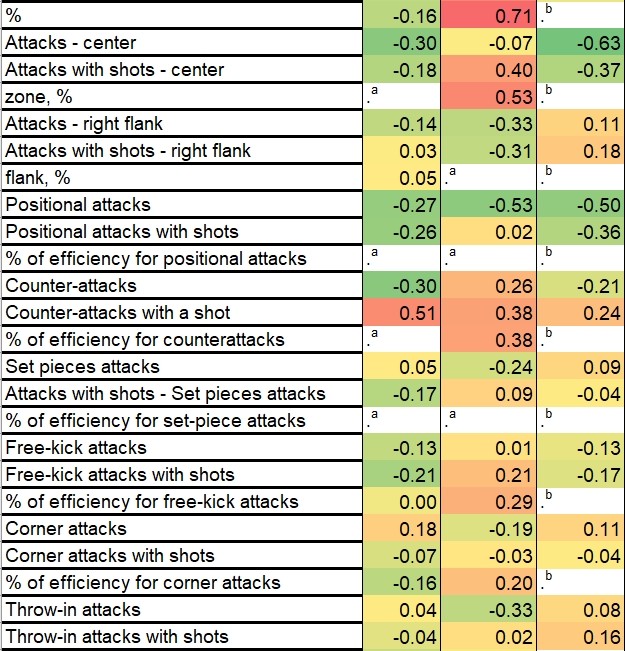

The biggest difference in correlation from season 2021/22 to 2022/23 with victory
In this paragraph, I’m analysing which segments of the game made the highest change from last season. It is measured in statistical correlation with victory.
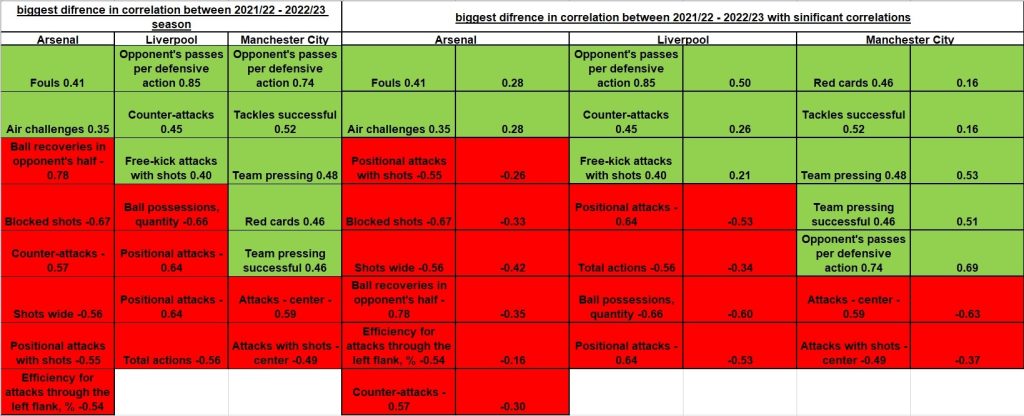
Arsenal made the highest increase in significant correlation with victory in fouls (an increase of 0.41) and air challenges (an increase of 0.35). On the other side highest decrease in significant correlation Arsenal made with: ball recoveries in the opponent’s half (-0.78), blocked shots (-0.67), counter-attacks (-0.57), shots wide (-0.56), positional attacks with shots (-0.55) and efficiency for attacks through the left flank, % (-0.54). It seems that Arsenal is more capable to create successful actions from “scratch” this season than last and they have more options in the creation of successful actions which might be more direct this season than the last one. It does not mean necessarily that Arsenal has weaker ball recoveries, blocked shots and other above-stated variables, but because of the change in game style, they are using it less.
For Liverpool highest increase was in the opponent’s passes per defensive action (0.85), counter-attacks (0.45) and free-kick attacks with shots (0.40). The highest decrease in correlation with a victory was in: ball possessions, quantity (-0.66), positional attacks (-0.64) and total actions (-0.56). It is obvious that Liverpool is having decreased in the creation of successful actions from “scratch”, but they perform well if the ball is in the opponents’ possession and combined with counter-attacks as well, but it does not bring more victories to them.
Manchester City had the highest increase in correlation with victory in opponent’s passes per defensive action (0.74), tackles successful (0.52), team pressing (0.48), red cards (0.46) and the team pressing successfully (0.46). On the other side highest decrease with a victory was in attacks – centre (-0.59) and attacks with shots – centre (-0.49). It might be that Manchester City has increased intensity in team pressing this year but it might be over-aggressive which results in red cards, tackles and team pressing itself. Also, they have started to use both sides as well as centres for attacks. Or maybe more precisely, they are much more expected from opponents in attacks in the centre while flanks are more open. If Manchester persists in attacks in the centre, its lower chances for victory. Manchester should spread attacks on both sides as well.
Highest statistically significant correlations among the biggest difference in correlation from season 2021/22 to 2022/23 with victory
An increase in Arsenal with fouls and air challenges has a 0.28 strength of positive correlation which is a weak correlation. The strongest negative correlation is with shots wide (-0.42), Ball recoveries in the opponent’s half (-0.35) and blocked shots (-0.33) which are moderate negative correlations. Arsenal obviously has problems if they lose the ball on the opponent’s side and they should stream to finish each action rather than be interrupted in the field which has a negative influence on victory. It might be that the next step in the development of their game will be in reaction to lost balls and preventing counter-attacks.
For Liverpool highest positive correlation among those with the highest change in correlation with victory is with: the opponent’s passes per defensive action (0.50) – strong/moderate, counter-attacks (0.26) and free-kick attacks with shots (0.21) – weak. The strongest negative correlation among those which decreased significantly is with: ball possessions, quantity (-0.60), and positional attacks (-0.53). Liverpool is not using possession of the ball efficiently, and they achieve their victories more through counterattacks and opponents’ instability after losing the ball in the field. There might be more reasons for this including motivation and intensity of the general performance.
In Manchester City’s case strongest positive correlation with victory, among those correlations which increased most is with: Opponent’s passes per defensive action (0.69), team pressing (0.53) and the team pressing successfully (0.51) which are all strong correlations. The highest negative significant correlation among those which decreased most in Manchester is with: attacks – centre (-0.63) – strong and attacks with shots – centre (-0.37) – moderate. Manchester City is very efficiently using team pressing and this segment is something their opponents should be aware of. On the other side, when Manchester is in possession of the ball, this year, opponents are prepared for their actions through the centre and Manchester should change something or move to flanks as well to create more time for their players to use more available space than if they use just centre.