TOP 100 EUROPEAN CLUBS BY ENTERPRISE VALUE TOP 100 EUROPEAN CLUBS BY ENTERPRISE VALUE
  • ABOUT
  • SERVICES
  • BLOGS
  • PEOPLE & WORKS
  • LEADERS
  • CONTACT
  • ABOUT
  • SERVICES
  • BLOGS
  • PEOPLE & WORKS
  • LEADERS
  • CONTACT

July 2022

TOP 100 EUROPEAN CLUBS BY ENTERPRISE VALUE

publicly traded clubs included) without taking into consideration of market capitalization, debt, and cash? Yes, TOP 100 European clubs by enterprise value calculated!

After four months of research, I and my team were dealing with calculations of the enterprise value of TOP 100 European clubs using statistical analysis to find an algorithm that does not use data about market capitalisation, debt, and cash, but data from financial reports.

So, what is enterprise value? It is a value you would pay for business if you were aiming to purchase it or, a value you would receive if you would sell your business. The following formula is used to determine the enterprise values of publicly traded businesses:

Enterprise Value = Market Capitalization + Debt (short and long term) – Cash (and cash equivalents)

But what if you want to buy a club which is not publicly traded? There are several methods how for calculating it:

1.      Comparable Company Analysis (CCA)

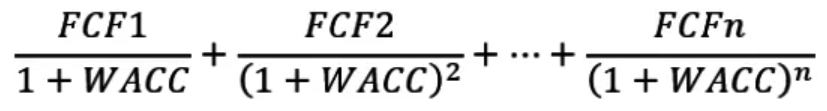
2.      Discounted Cash Flow (DCF) method

3.      First Chicago Method

4.      Asset-based method

All of these methods are in more detail explained on the following link (https://corporatefinanceinstitute.com/resources/knowledge/valuation/private-company-valuation/ ), but one can find a lot of literature on the web.

I will just quote snapshots from definitions:

Ad1. The Comparable Company Analysis (CCA) method operates under the assumption that similar firms in the same industry have similar multiples.

Ad2. The Discounted Cash Flow (DCF) method takes the CCA method one step further. As with the CCA method, we estimate the target’s discounted cash flow estimations, based on acquired financial information from its publicly traded peers.

Ad3. The First Chicago Method is a combination of the multiple-based valuation method and the discounted cash flow method. The distinct feature of this method lies in its consideration of various scenarios of the target firm’s payoffs. (Usually, this method involves the construction of three scenarios: a best-case (as stated in the firm’s business plan), a base-case (the most likely scenario), and a worst-case scenario. A probability is assigned to each case.)

Ad 4. The asset-based method is used when is more profitable to liquidate a firm than continue with business because with liquidation firm will have better cash flow than if it continues with business.

If you don’t know which method to use, help could also be found at „The International Valuation Standards Council” – IVSC or national agencies for evaluation of firms.

In this research, the goal was to assess publicly and non-publicly traded clubs to calculate their enterprise value. Since there is no share price for non-traded clubs, we have been looking for the club’s overall environment which would influence on share price to go up or down. There is a lot of literature about reasons for share price fluctuation generally, but also specifically for the football industry as well. Joao Duque and Nuno Abrantes Ferreira from Instituto Superior Economia e Gestao, Universidade Tecnica de Lisbao have found positive relationship between sporting performance and share price. José Allouche from Université de Paris 1 Panthéon-Sorbonne, Paris and Sébastien Soulez from Université Lumiere Lyon 2, Lyon have found that sporting results positively influence on share price after victory and vice versa. Further on, they have found that managerial decisions about running and investing in sporting facilities, sponsoring and positive financial results influence positively the share price and in case of unfavourable financial results influence negatively the share price. Also, they have found the relationship between human resources (players) and share price. Similar is found in Turkey regarding winning (https://www.jstor.org/stable/41343433), where winning in the European cup does not affect club stock share returns while winning in domestic matches does influence positively.

However, a number of “things” might influence share price, and those “things” make “footprints” for enterprise value in the world around us. So, our first goal was to identify as many “footprints” as possible and collect data about them. Data we have been using were data which are not data from financial reports, not data about share prices. Instead, we have been using a spectrum of external (not from club documents or reports) and exclusively publicly available data.

The final goal was to find the algorithm in the standardized model for the spectrum of clubs from the lowest enterprise value in Europe to clubs with the highest enterprise value in Europe (from 0mil € or something less to 3200mil€). The second goal was to find an algorithm which is time resistant as long as possible. Finally, the algorithm was found using different analyses in inferential statistics and we have made the list of TOP100 clubs in Europe by enterprise value (MoF further in text).

Before release, an algorithm in a standardized model was tested in several ways. First, algorithm results were checked by logical enterprise value in reality for the whole span of club values, from lower valued clubs as well as high valued clubs (span should go from 0 to 3200mil€ in the logical sense). The second quality check was confirmed by statistical analysis rules. The third was a comparison with enterprise value calculated by KPMGs spin-off, Football Benchmark (https://www.footballbenchmark.com/library/football_clubs_valuation_the_european_elite_2022); comparing results of enterprise value with KPMGs spin-off, Football Benchmark we receive 99.4% of statistically positive significant correlation between results. The fourth was sales which happened in 2021 in the UEFA report (https://editorial.uefa.com/resources/0272-145b03c04a9e-26dc16d0c545-1000/master_bm_high_res_20220203104923.pdf). Fifth was using data from years before instead of one, last year.

We have been looking on 11 external areas as “footprints” of what’s happening within the club for a period of time. Those areas are 1. success in European competitions (UEFA), 2. investment in the team, 3. social networks, 4. team structure, 5. value of the team, 6. Sale-buying, 7. stadium, 8. attendance, 9. domestic competition, 10. general environment and 11. football environment. Through different stages of research, we have been using in total more than 160 different variables to find the final standardized algorithm. Also, we have been using data about single variables from 5 years before and for some variables even 10 years before.

We have been analysing 227 clubs from 36 European leagues. 31 leagues are from the 1st national tier and 5 leagues are from the 2nd national tier:

1ESP – La Liga
2ESP – La Liga 2
3ENG – Premier league
4ENG – Championship
5GER – Bundesliga
6GER – 2. Bundesliga
7FRA – Ligue 1
8FRA – Ligue 2
9ITA – Serie A
10ITA – Serie B
11TUR
12POR
13NED
14SCO
15SVI
16ROU
17UKR
18BEL
19RUS
20GRE
21POL
22SER
23CRO
24AUT
25HUN
26CZE
27DEN
28NOR
29SWE

In the analysis were included all clubs from the Big 5 leagues and the best clubs from other listed leagues. More clubs per league were selected from the following leagues: Netherlands, Portugal, Turkey, Belgium, English Championship and Russia (*this year’s results are not affected by the war in Ukraine for Ukraine and Russian clubs).

Of all those clubs, the TOP 100 clubs by enterprise value are:

 ClubStateEV – mil€
1Real MadridSPA3139
2FC BarcelonaSPA3019
3Manchester UnitedENG2867
4Liverpool FCENG2847
5Bayern MunichGER2727
6Manchester CityENG2540
7Chelsea FCENG2299
8Paris Saint-GermainFRA2053
9Tottenham HotspurENG1761
10Arsenal FCENG1623
11Juventus FCITA1558
12Borussia DortmundGER1347
13Atlético de MadridSPA1116
14Inter MilanITA1052
15AC MilanITA766
16Leicester CityENG670
17SSC NapoliITA655
18Everton FCENG633
19RB LeipzigGER625
20Bayer 04 LeverkusenGER582
21AS RomaITA544
22Olympique LyonFRA542
23AFC Ajax AmsterdamNED469
24AS MonacoFRA451
25Valencia CFSPA431
26FC PortoPOR401
27SL BenficaPOR377
28Real SociedadSPA356
29Olympique MarseilleFRA350
30Wolverhampton WanderersENG346
31Atalanta BCITA344
32Aston VillaENG341
33SS LazioITA326
34Borussia MönchengladbachGER312
35Galatasaray A.S.TUR309
36Southampton FCENG305
37Sevilla FCSPA292
38TSG 1899 HoffenheimGER274
39Sporting CPPOR274
40ACF FiorentinaITA272
41West Ham UnitedENG259
42Eintracht FrankfurtGER244
43Crystal PalaceENG242
44Fenerbahce SKTUR241
45Newcastle UnitedENG239
46Villarreal CFSPA237
47VfL WolfsburgGER233
48LOSC LilleFRA232
49PSV EindhovenNED226
50Athletic BilbaoSPA222
51FC Schalke 04GER221
52Red Bull SalzburgAUT207
53AFC BournemouthENG204
54OGC NiceFRA202
55Real Betis BalompiéSPA198
56Shakthar DonetskUKR184
57FC ZenitRUS178
58Torino FCITA177
59Brighton & Hove AlbionENG174
60Stade Rennais FCFRA174
61US SassuoloITA168
62Fulham FCENG168
63Hertha BSCGER161
64Watford FCENG155
65Club Brugge KV BEL149
66PFC CSKA MoskvaRUS141
67FC Girondins BordeauxFRA140
68Getafe CFSPA139
69Celtic FCSCO136
70FC Spartak MoskvaRUS136
71RSC AnderlechtBEL135
72VfB StuttgartGER134
73Burnley FCENG133
74Celta de VigoSPA132
75SV Werder BremenGER130
76Feyenoord RotterdamNED129
77SC BragaPOR125
78Udinese CalcioITA123
79AS Saint-ÉtienneFRA122
80GNK Dinamo ZagrebCRO122
811.FSV Mainz 05GER120
82Cagliari CalcioITA119
83West Bromwich AlbionENG119
84Dynamo Kyiv UKR118
85Bologna FC 1909ITA118
86SC FreiburgGER116
87Leeds UnitedENG116
88UC SampdoriaITA111
89Stoke cityENG108
90RCD Espanyol BarcelonaSPA106
91Olympiacos PiraeusGRE106
92KRC Genk BEL104
93FC NantesFRA103
94Swansea cityENG102
95AZ AlkmaarNED101
96Norwich CityENG101
97Montpellier HSCFRA99
98TrabzonsporTUR97
99Lokomotiv Moscow RUS96
100FC Basel 1893SVI93
TOTAL50 414 mil€

The total value of TOP 100 clubs is 50,414 bil. € coming from 18 European leagues with two leagues from the 2nd national tier (English Championship and German 2. Bundesliga):

  Tot value clubs-TOP100% of league clubs-TOP100Average value-TOP100
1ENG – Premier league1834995%882
2SPA938660%469
3GER – Bundesliga722667%382
4ITA633270%317
5FRA446855%223
6POR117722%65
7NED92522%51
8ENG – Championship70021%29
9TUR64715%32
10RUS55125%34
11BEL38717%22
12GER – 2. Bundesliga35111%20
13UKR30213%19
14AUT2078%17
15SCO1368%11
16CRO12210%12
17GRE1067%8
18SUI9310%9

In the above table, values of clubs from a single league were summarized to identify differences between leagues in TOP 100 enterprise value. The highest enterprise value of clubs from a single league in TOP100 is having English Premier league (18349mil€) followed by Spain La Liga (9386mil€), German Bundesliga (7726mil€), Italy Serie A (6332mil€) and French Ligue 1 (4468mil€). English Premier league is pointed out with almost double as value as Spain La Liga. Further on, English Championship is the 8th league (700mil€) in Europe by the value of clubs in TOP100 (German 2. Bundesliga is the 12th league by value (351mil€) of clubs from one league in TOP100).

If we look at the column “% of league clubs-TOP100” we will see again that the English Premier league pointed out, that 95% of clubs from the league, or 19 (Brentford is out) are part of TOP100, followed by Italy Serie A (70%), German Bundesliga (67%), Spain La Liga (60%) and France Ligue 1 (55%).

The column “Average value-TOP100” is the value from all clubs from one league in TOP 100 divided by the number of clubs in the observed league. Leagues with a higher number of clubs will have less average if they have the same number of clubs in the TOP 100 as leagues with fewer clubs in it. Again, the English Premier League is having the highest average (882mil€) followed by Spain’s La Liga (469mil€), German Bundesliga (382mil€), Italian Serie A (317mil€), and France Ligue 1 (223mil€).

Those two columns (“% of league clubs-TOP100”, and “Average value-TOP100”) might indicate the concentration of overall competition and quality of the observed league. A higher percent of league clubs and average might mean higher quality and competition in the league.

If we compare results from the MoF EV list and results from KPMGs spin-off Football Benchmark, the biggest positive differences are with the following clubs (MoF EV – KPMG EV):

 ClubMoF-KPMG (EV)
1Liverpool FC291
2FC Barcelona205
3AC Milan188
4SSC Napoli172
5Leicester City FC144
6AS Roma131

It is noticeable that generally Italian clubs are generally higher valued in the Mof EV algorithm than in KPMG’s spin-off, Football Benchmark with the highest percent of the difference in EV from KPMGs  (SSC Napoli 36%, AC Milan 32%, and AS Roma 32%).

Biggest negative differences (MoF EV – KPMG EV):

 ClubMoF-KPMG (EV)
1Tottenham Hotspur FC-151
2Atletico de Madrid-118
3Atalanta BC-110
4Sevilla FC-98
5Paris-Saint Germain FC-79
6Villareal CF-66

The list of 32 clubs from Football Benchmark is different from Mof EV list. Clubs which are on Mof EV list but not on Football Benchmark one, are RB Leipzig, Bayer 04 Leverkusen, AS Monaco, Real Sociedad, Olympique Marseille and Wolverhampton Wanderers.

The characteristic of this method is that at any moment value of any club in Europe can be calculated based on publicly available data. Although results were tested with KPMG’s spin-off Football Benchmark and sales which really happened, using financial reports for another step of testing the model would be beneficial.

Model by itself reveals what from reality influences most on the enterprise value of the clubs and as such, they can be used for setting relevant and measurable goals for the top management of the club, and for setting KPIs for the top management of the clubs.

Although enterprise value is important when one is investing in the club, estimating the potential of an individual club and the gap which it can fill is of big importance as well. It depends not just on clubs’ inner potential (financial, human resources, community, infrastructure …) but also on football’s external environment and general environment and based on other research results that are interesting in combination with EV research.

Next research…

The quality of human capital in club management is interesting as well as sports staff especially. So, on my list of next research is a calculation of standardized model of quality of management of clubs and standardized model of quality of sport management of the club. Besides that, two research on the “to do” list is research about brand and research on talents.

If you have any comments, we would be grateful to talk about this, what do you think about the possibility of this kind of calculations of enterprise value, what do you think about results and do you have maybe any idea about improving this research (combining with financial reports would, of course, be very useful but here is an idea to use date, not from financial research) and about further research. Special thanks go to Nikica Krnić, Konstantin Kornakov and Josip Korda.

Check out this article on LinkedIn:

Read More
WHAT IS ESSENTIAL FOR RUNNING A SUCCESSFUL ACADEMY?

As I have been analyzing in last articles, most important of 12 quality areas are Cognitive care, Human capital, Productivity and Talent identification.
You can find articles on following links:
1.    How we perceive the physical and „decision making“ characteristics of players, how we can measure them and develop them? Click to read more.
2.    About what is “produced” in the academies and what we could “produce” as well. STAVITI LINK NA WEBU_BLOG GDJE SE NALAZI 3.    What do we about „digital life“ of kids in an academy, do we do anything about it and what could we do. Click to read more.

4.    Relation between academies and player agents. Click to read more.
5.    What academies across Europe do most often and what do they the least? Click to read more.
 
Most important quality areas were detected over working processes used on daily basis in youth academies. You will find all this quality areas in most used, least used, most correlated working process and in analysis of interviews.


Those working processes are separated in 17 quality areas. Among them most important are Youth academy – players, Youth academy – Coaches and Youth academy – Staff.


Finally, in development of youth academy, among 17 working areas and 12 quality areas, focus should be on coaches, staff, and players from one side and human capital, cognitive care, productivity and TID from the other side. Finally, ingredients are club buy-in and strategic importance for academy. That’s the path to follow to get to maximum of your potentials. Having this you will develop other quality and working areas as well!

Read More
TOP ONE FACTOR FOR RUNNING SUCCESSFUL FOOTBALL CLUB

Here is top one factor for running a successful football club…  

It’s PEOPLE!

Well, like in any industry, but also as well like on the pitch – placing the right people in the right positions and helping them to be prepared to use their maximum potential.  

To help them enjoy in what they are doing, and to help them perceive obstacles as challenge rather then problems. 

If you choose people (on and of the pitch), not just by expertise but also by alignment of their values to the same values others have – if those values are the same as Club has developed them with his community throughout history, there is very good chance to have good environment for development of successful club.   As same as you invest in players in the pitch providing them any support necessary, you can invest in other people (coaches, staff, administration, management…) …

Because – they are all part of the same chain. Players (and performance they present on the pitch) are “just” the last, still most visible but also, in most cases, most short-term part of chain. Players leave (almost all), others stay (almost all)! Helping those people “in the backstage” will make them feel happier, club will be more sustainable, and they will deliver more for the players, club and finally for community – for same passion which glues each unique club stakeholders together and makes this industry so attractive! 

Read More
WHAT ACADEMIES ACROSS EUROPE DO MOST OFTEN AND WHAT DO THEY THE LEAST?

First, I suggest you to read ECA research on Youth academies available on https://lnkd.in/eQh69vNt. Here are a few tips on how to use this publication:

1.     Go through the list of working processes used in the survey and see if you find any working process on the list interesting for you and are willing to work on its implementation (feel free to contact me for a list of working processes if you haven’t saved them from survey)

2.     Go through lists of most used working processes and see if you have all of them (pages 60-61)

3.     Go through the list of least used working processes and see which you don’t have (pages 62-63)

4.     Go through the list of most correlated processes and try to identify causality for correlation and see how those working processes are relevant in your academy (pages 64-67)

5.     If you find a specific working process especially interesting to you, feel free to contact me to reach out for the list of working processes it is correlated with.

6.     Go through the list of most recognized indicators of successful transition from academy to the first team and cross-check it with your club (pages 70-73).

Most and least used working processes in academies.

What do academies across Europe do most often? What is a “must” to have. On the other side what are the least number of working processes academies are doing. Most used working processes are observed in two margins: those which are used in more than 90% of academies and those which are used between 80% and 90% of academies. Least used working processes are observed in margin of less than 25%.

Areas of working processes are following ones:

Talent identification

› Environment perspective

› Club perspective

Youth academy

› Playing style

› Players

› Coaches

› Teams

› Scouting

› Sale of players

› Infrastructure

› Staff

› Parents

› Player agents

› School and academy community

Transition from youth academy to first team

Selling/leaving the club

Other departments

Decision making

It is obvious that most used working processes are related to talent identification from perspective of environment of player in TID. On the same level are working processes related to playing style in academies. Among these processes areas it is recognized that strong focus are on human capital and cognitive care.

To see dynamic, we have made an analysis of margin 80-90%. 

In this margin we can see that dynamic of change is happening and more focus is on area related to relations with players. Better said there is focus on individual development of each player. This area is followed by relations with and school and academic institutions. Besides player, areas of “coach”, “staff, “school and academy community”, “TID-club” and “transition from youth academy to the first team” are represented in both of most used margins. Areas related to the environment of players in processes related to talent identification are lost as well as working processes related to playing style and relations with parents.

Most leased used working processes in research made are related to player agents as I have already written in prior articles. Processes related to cognitive care are well presented starting from measuring IQ of players and coaches but also other cognitive care processes. Personal brand of players is still not well recognized as topic important for development of young players. Also, questionnaire before leaving the club as much as it seems easy to do, is done in very few clubs across Europe. Still, one should think are there some new insights hidden which can be easily reached.

Only working areas which are represented in all three analyzed margins are: “players”, “coaches” and “staff”. Those working areas and processes within them could be understood as core of academy.

Read More
HOW DO WE WORK WITH FOOTBALL PLAYER AGENTS?

First, I suggest you read ECA research on Youth academies available on https://lnkd.in/eQh69vNt. Here are a few tips on how to use this publication:

1.     Go through the list of working processes used in the survey and see if you find any working process on the list interesting for you and are willing to work on its implementation (feel free to contact me for a list of working processes if you haven’t saved them from survey)

2.     Go through lists of most used working processes and see if you have all of them (pages 60-61)

3.     Go through the list of least used working processes and see which you don’t have (pages 62-63)

4.     Go through the list of most correlated processes and try to identify causality for correlation and see how those working processes are relevant in your academy (pages 64-67)

5.     If you find a specific working process especially interesting to you, feel free to contact me to reach out for the list of working processes it is correlated with.

6.     Go through the list of most recognized indicators of successful transition from academy to the first team and cross-check it with your club (pages 70-73).

Looking forward to hearing (reading) your opinion, ideas, and comments!

Relation between academy and player agents.

So, how are we dealing with the agents of players as one if not most important but second to most important stakeholder of external players environment next to parents?

If we see list of least used processes in the academies based on research done by LTTsports for ECA we will find that most represented are working processes dealing with players agents.

It is obvious that for some reason these processes are not in focus like other working processes related to players development and still, could have significant influence on player development not just from football perspective, but also from human perspective.

If we take into consideration relation with parents, we can see that we have much more used same or similar working processes with parents than with agents. Regular meetings with parents are held in 92% of clubs while more than double less (40%) are conducting regular meetings with agents.

If we see about group meetings the difference is even larger, it goes from 89% in case of group meetings with parents to 9% in case of group meetings with agents. It is interesting that percent of individual meetings with parents and group meetings with parents are very close in percent (92%-89%) while individual and group meetings with agents are having much bigger difference (40%-9%). Least used are group meetings with agents. It could be challenging process to club, but it might be interesting to identify why is it so challenging if so.

As most important environment which could influence on environment in which kids playing in academy are most of the time and make biggest decisions, are related to parents and agents. Again, in process of assessment in which it is not necessary to include stakeholders (parents/agents) is first of all not broadly used and second, process related to parents is more used (46%) than process of assessment related to agents (20%).

It is not usual to have neither internal rule for working with agents (34%) neither rule limiting or excluding agent in place (6%). It could be that most comfort working zone for working with football academies could be for agents. If we see behavior standards proscribed for parents, we see that is well established (78%) about youth academy environment across Europe. 

We cannot influence on parents as most important part of kids’ environment. As a club it is often said that club (an academy within) is having DNA/identity or set of values which describes club as unique. Those set of values are not just stated for communication or marketing purposes, they are stated as guidelines for seeking compatible partners from different stakeholders. When academy is hiring coach or signing players it is well used process of assessing personality, in coach case 74% and players 80%. 

Those assessments are made, among others, to check player/coach compatibility with values and other club employees/players and to reach goals set up for hiring/signing. Finally for player agents it seems it is, again not well used. Based on research 5% of academies suggest the use of specific agent. Of course, the principle of defining suggestions should be defined clearly and communicated openly and transparently as key part of process.

Most leased used working processes in research made are related to player agents. Although we use the same working processes for other stakeholders it is not common to use it when academies are dealing with agents of players. Individual meetings with parents/agents, group meetings with parents/agents, assessment of personality of players/coaches/agents are working processes which present difference in not using processes for agents which are used for other stakeholders. Still, as important part of kids’ environment agents are influencing on their development as players but also as human beings. Some agents might better fit to some club than others as clubs are having different identities and develop on different strategies which reflects to different scouting and more general business politics.

If you want to implement these processes within your club, the process could be:

  1. Identify values which you are protecting within your club.
  2. Identify description of environment you think is best for kids’ development.
  3. Make procedure of assessment of each players agent.
  4. Assess agents by their comparability with club identity.
  5. Clearly define set of rules for agents of players.
  6. Openly and transparently communicate these rules to relevant stakeholders which must include at least agents, parents, agents, coaches, and staff.
  7. Measure and report on development of agent behavior.
  8. Educate parents about relevance of these process and introduce to them the use of same working processes for other stakeholders which include parents as well.

*It is recommended to have an expert in social network, communication, pedagogy, business, and expert in psychology included in this process.

Read More
SOCIAL NETWORKS AND YOUNG FOOTBALL PLAYERS?

First, I suggest you to read ECA research on Youth academies available on https://lnkd.in/eQh69vNt. Here are a few tips on how to use this publication:

1.     Go through the list of working processes used in the survey and see if you find any working process on the list interesting for you and are willing to work on its implementation (feel free to contact me for a list of working processes if you haven’t saved them from survey)

2.     Go through lists of most used working processes and see if you have all of them (pages 60-61)

3.     Go through the list of least used working processes and see which you don’t have (pages 62-63)

4.     Go through the list of most correlated processes and try to identify causality for correlation and see how those working processes are relevant in your academy (pages 64-67)

5.     If you find a specific working process especially interesting to you, feel free to contact me to reach out for the list of working processes it is correlated with.

6.     Go through the list of most recognized indicators of successful transition from academy to the first team and cross-check it with your club (pages 70-73).

Looking forward to hearing (reading) your opinion, ideas, and comments!

What are we doing re “digital life” of kids in an academy?

So, what are we taking doing re “digital life” of kids in an academy? What are challenges to kids and how they use it.

One of least used processes in the academies based on research done by LTTsports for ECA is “The club does employ anyone to take care of players personal brand” and it is truth in 16% of clubs.

Based on an article made by Ofcom (Great Britain regulator for the communications services that we use and rely on each day; https://www.linkedin.com/company/ofcom/ ) available on link https://www.ofcom.org.uk/news-centre/2022/one-in-three-internet-users-fail-to-question-misinformation. Based on an article, usage of social network is huge, based on source used in an article (World Economic Forum, August 2021, Here’s what happens every minute on the internet in 2021; https://www.weforum.org/agenda/2021/08/one-minute-internet-web-social-media-technology-online/ ), every minute sees 500 hours of content uploaded to YouTube, 5,000 videos viewed on TikTok and 695,000 stories shared on Instagram. Furter on among older children aged 12-17, 74% of them are confident that they can correctly estimate if content on social network is fake but only 11% are able.

Despite being under the minimum age requirement (13 for most social media sites), 33% of parents of 5-7s and twice as many 8-11s (60%) said they have a social media profile. Older children are most likely to have a profile on Instagram (55% of 12-15s), while younger children aged 8-11 were more likely to have profiles on TikTok (34%) and YouTube (27%). TikTok is growing in popularity, even among the youngest age groups; 16% of 3–4-year-olds and 29% of 5-7s use the platform (Ofcom).

Still, it seems it might influence on kids focus based on same article. Children reported being unable to watch films, or other long-form content, without being on multiple devices at the same time. In fact, only 4% of children aged 3-17 say they never do anything else while watching TV (data from The Insights Family).

More than a third of children (35%) reported engaging in potentially risky behaviours, which could hinder a parent or guardian keeping proper checks on their online use. A fifth surfed in incognito mode (21%), or deleted their browsing history (19%), and one in 20 circumvented parental controls put in place to stop them visiting certain apps and sites (6%). Of those profile lot of them are fake. Based on Ofcom research, two-thirds of 8-11-year-olds had multiple accounts or profiles (64%). Among these, almost half (46%) have an account just for their family to see. A fifth of 16-17 years-olds (20%) choose to have separate profiles dedicated to a hobby such as skateboarding, gaming or photography.

Still, some kids are recognizing positive side of social networks, using it for wellbeing. Based on an article, over half (53%) of 13–17-year-olds feel that being online is good for their mental health, compared with 17% who disagreed.

From sport and wellbeing perspective in Ofcom article could be found that eight in ten 13–17-year-olds are using online services to support their personal wellbeing. A quarter said they have learnt about healthy eating online or have found help with ‘growing-up issues’ like relationships and puberty. A fifth used the internet to follow fitness programmes and health trackers, or to get help when feeling sad, anxious, or worried. Similarly, about one in 10 went online to help with sleep issues, to meditate, or to help them feel energized, with Calm (34%) and Headspace for Kids (29%) the most popular apps used (Ofcom).

Finally, kids are using almost regularly social networks from very young ages (despite minimum age requirements), they are aware that they are engaged in potentially risky behavior, their focus on long term content is regularly disturbed by using other devices and big majority of kids are having multiple profiles on social networks. On the other side big majority use online services to support their wellbeing and some are using it for fitness programmes and health trackers. They also learn about relationship on social services content. Also, based on kids’ presence it could also be used in talent identification process. So, it is important part of their life, and they find it credible in significant percent of kids population. Still, I would say, just 16% of clubs are employing somebody to care about players’ personal brand.

If we see that, based on an article “‘Social Media Manager’ is One of the Most Popular Jobs in the US. It’s a Lot Harder than it Sounds” by Greta Rainbow from 2020 (https://money.com/social-media-jobs/), social media manager is most wanted jobs, topic of having working process related to kids “digital” life or life’s might be on the table within football youth academies as well. They are using and providing content available on social networks forever. Once on internet, always on internet. Also, important part of their identity is their “digital” identity, and it influences on their mood, on their focus on daily tasks related to school but also trainings and match played. Teaching them how to use it and helping them express their content is not just exercise related to social network but much more, it helps them deal with spectrum of situations which they will benefit as human beings in their life.

If you want to implement this process within your club, the process could be:

  1. Identify most common treats on social networks for kids.
  2. Identify most useful, recommended content on social services for kids.
  3. Educate kids how to provide content in safe and sustainable perspective from content side.
  4. Educate kids how to deal with conflict situation on social networks.
  5. Introduce to kids’ communication channel and expert whom they can address to related to any question related to dealing with the content on the social services.
  6. Help them make development plan for social network profiles.
  7. Take care about kids’ privacy.
  8. Regularly follow their publicly available social networks profiles.
  9. Measure and report on development of their profile.
  10. Educate parents and managers about all prior steps.

*It is recommended to have an expert in social network communication and expert in psychology included in this process.

Additional reading:

“The German Young Olympic Athletes’ Lifestyle and Health Management Study (GOAL Study): design of a mixed-method study” byA. Thiel, K. Diehl, K. E. Giel, A. Schnell, A. M. Schubring, J. Mayer, S. Zipfel & S. Schneider https://link.springer.com/article/10.1186/1471-2458-11-410

“The Pros and Cons of Athletes using Social Media” by Sarah Daren https://www.coachesclipboard.net/athletes-and-social-media.html

“The Impact of Social Media on Youth Athletes” by Luke Smith https://www.stack.com/a/the-impact-of-social-media-on-youth-athletes/

“Social Talent Scouting: A New Opportunity for the Identification of Football Players?”, by Elena Radicchi, Michele Mozzachiodi,

https://sciendo.com/downloadpdf/journals/pcssr/70/1/article-p28.pdf“Beyond recreation: Personal social networks and social capital in the transition of young players from recreational football to formal football clubs”, by Edoardo GF Rosso and Richard McGrath, https://journals.sagepub.com/doi/abs/10.1177/1012690212444409

Read More
We don’t produce just players in football academies!

First, I suggest you read ECA research on Youth academies available on https://lnkd.in/eQh69vNt. Here are a few tips on how to use this publication:

1.     Go through the list of working processes used in the survey and see if you find any working process on the list interesting for you and are willing to work on its implementation (feel free to contact me for a list of working processes if you haven’t saved them from survey)

2.     Go through lists of most used working processes and see if you have all of them (pages 60-61)

3.     Go through the list of least used working processes and see which you don’t have (pages 62-63)

4.     Go through the list of most correlated processes and try to identify causality for correlation and see how those working processes are relevant in your academy (pages 64-67)

5.     If you find a specific working process especially interesting to you, feel free to contact me to reach out for the list of working processes it is correlated with.

6.     Go through the list of most recognized indicators of successful transition from academy to the first team and cross-check it with your club (pages 70-73).

Looking forward to hearing (reading) your opinion, ideas, and comments!

*you can find the publication on this link https://www.linkedin.com/posts/slaven-marasovi%C4%87-075b551b_research-based-on-working-processes-in-academies-activity-6909413896734822400-64VV?utm_source=linkedin_share&utm_medium=member_desktop_web

What are we “producing” in an academy?

So, what are we “producing” in an academy? Obviously, players, but is there something else to “produce”?

Let’s see the player “production” case from Polish Ekstraklasa. If we see the table beneath, we will see that club which is in the top 3 (Lech) by points won in the last five seasons is having 87% of players’ value from homegrown players. Also, 16 of 25 sold players are homegrown players. On the European level, from a previous European Club Association (ECA) survey in 2017, results showed that for almost 60% of the participating club representatives, the academy is a source of revenue for their club. If you see other data on the table beneath, you will find that number of such players is transferred to another club for a fee and sometimes most players transferred with a fee were homegrown players. 

Looking at on next facts list beneath, it is obviously that homegrown players are well recognized on the market (based on Polish Ekstraklasa analysis, made with Josip), although they generally, sometimes have problems in the transition from academy to the first team and as well in adaptation to the new environment after changing the club.

So, is there anything else you can “produce” in an academy besides players? I and my colleagues (Konstantin and Adam from LTTsports and Pouya from ECA) have asked academy directors do they produce coaches for 1st team and then transfer them on the market for fee. Also, we have asked them do they have a working process for the development of football to forecast how football will look alike in 5-10 years, a period in which most of your youth players will be playing professional football.

Out of 18, one interviewed academy is producing coaches for 1st team and further on for market sale, just as most of you usually do for players. Those coaches are coming from academies and maybe is worth spending a few words about the additional benefits of this process. It is most likely that the transition of players from youth academy to the 1st team will be much easier with a coach they already know and are very familiar with him, his training methodologies, playing style, communication, and general, overall environment. Support from above (board and 1st team coach) is one of the most recognized pillars for a successful transition from academy to 1st team found in this report. Is it likely that they will perform better under such a coach? Based on the importance of the transition process from the academy to the 1st team, most likely, yes. Finally, their value is higher. 

From the club management side, finding a coach which will raise the value of youth homegrown players based on better performance is crucial, but also very challenging. A lot of times it can be failed for different reasons. And more expensive as well. For practical reasons, you can look at history where 1st team coach came up from the academy with homegrown players. Since each academy is having coaches on it’s it is maybe worth thinking about the process for their development for 1st team.

Also, in the transition process same playing style is recognized as one of the very important pillars of a successful transition. Besides having the same coach in the 1st team as in the academy, if we are using same playing style in the 1st team as we did in the academy, we are having more transition pillars in line. Developing, or “producing” playing style and tactical setup and making it competent in competition, then we will have more from of our potential of youth academy with the same investment in the academy and less investment in 1st team and most likely better performance, player (and coach?) value and finally results.

If you want to implement this process within your club, the process could be:

  1. Define the club’s values as part of the club’s DNA (include the community in the process)
  2. Align TID selection process (not just for players, but coaches and staff as well), playing style and 1st team based on values from the club’s DNA
  3. Create development path and individual plans for players and coaches selected in the TID process
  4. Implement a working process of developing playing style and tactical setup on regular basis to challenge your ones and to develop it further on.
  5. Create KPIs for each of three “products” (players, coaches, playing style and tactical setups)
  6. Regularly measure and report on development.
Read More
Development of football players?

In several next blogs, I will suggest topics that you can use to think about in your football academy. It will be supported by research results, and sometimes by other researchers as well.

So how to use this publication? You can use it following this procedure or using specific points of your interest:

1.     Go through the list of working processes used in the survey and see if you find any working process on the list interesting for you and are willing to work on its implementation (feel free to contact me for a list of working processes if you haven’t saved them from survey)

2.     Go through lists of most used working processes and see if you have all of them (page 60-61)

3.     Go through the list of least used working processes and see which you don’t have (page 62-63)

4.     Go through the list of most correlated processes and try to identify causality for correlation and see how those are working processes relevant in your academy (page 64-67)

5.     If you find a specific working process especially interesting to you, feel free to contact me to reach out for the list of working processes it is correlated with.

6.     Go through the list of most recognized indicators of successful transition from academy to the first team and cross-check it with your club (page 70-73).

Looking forward to seeing your opinion, ideas and comments!

*you can find publication on this link https://www.linkedin.com/posts/slaven-marasovi%C4%87-075b551b_research-based-on-working-processes-in-academies-activity-6909413896734822400-64VV?utm_source=linkedin_share&utm_medium=member_desktop_web

Development of players

Let’s see our focus on the development of players from two perspectives: “physical” and “decision-making”. If we see graphs beneath how much we are measuring “physical” and how much do we measure “decision-making” level we can conclude that we are much more focused on “physical” although players using, they physic as well as their “decision making” during the playing and training process.

So, we obviously create development plans for the “physical” side but do we have development plans for “decision-making”. If we don’t measure what are players’ strengths and weaknesses in the “decision-making” level how we can help them improve it or can we plan their role on the pitch during the game in the best possible way.

When we know weaknesses and strengths (characteristics of players), we can plan development for players but also his or her role on the pitch from both, “physical” and “decision-making” perspective.

So, better decision making, better performance on the pitch. I suggest you think and discuss within the club about including measurement of IQ and assessment of player’s personality in your working processes within the academy as well as working on development plans from that perspective! In any business, people are the key to the success so help them to develop as much as possible.

Let’s see data from the research about the topic.

Physical

If we see how much clubs do assess players about their physical capacities, we see that 98% of clubs surveyed do assess. There is one club in the survey that didn’t have an academy within the club which means that 100% of clubs that do have an academy assess players on their physical capacities.

If we see how much clubs assess technical capacity (not pure physical) we will see the percentage is less but still high.

Decision-making

On the other side if we see how much is assessed “decision-making” level we will see that interest is less with more “decision-making” characteristics assessed.

Players’ personality is assessed by 82% of clubs, while any kind of entrance psycho test is done in 35% of clubs.

Finally, IQ is measured in just 6% of clubs!

If you want to implement this process within your club, the process could be:

  1. Create a team that includes coach expert, pedagogue expert and psychology expert at minimum
  2. Measure IQ and have an assessment of players’ personality after signing (google “assessment center”)
  3. Make a development plan for each player
  4. Include players’ characteristics about decision making in his training and players’ game plan
  5. Regularly measure and report on development.

In the implementation of these processes, it is strongly recommended to have an expert in psychology included in the process.

If you want to see does IQ has an influence on performance on the pitch, I suggest additional reading:

http://aassjournal.com/article-1-910-en.pdf; Nima Nakisa (1), Mahboobeh Ghasemzadeh Rahbardar (2)

(1) Faculty of Physical Education and Sport Sciences, Kish International Campus, University of Tehran, Kish Island, Iran; (2) Mashhad University of Medical Sciences, Mashhad, Iran

https://www.frontiersin.org/articles/10.3389/fpsyg.2021.629827/full James Kenneth Bowman(1)*, R. Thomas Boone(2), Scott Goldman(3) and Alex Auerbach(4);

(1) Great Neck Public Schools, Great Neck, NY, United States; (2) College of Arts and Sciences, University of Massachusetts – Dartmouth, North Dartmouth, MA, United States; (3) Detroit Lions, Detroit, MI, United States; (4) Toronto Raptors, Toronto, ON, Canada

*You can google as well: “IQ and sports performance” “How to develop IQ” “How to improve decision making”

In several next blogs, I will suggest topics that you can use to think about in your football academy. It will be supported by research results, and sometimes by other researchers as well.  So how to use this publication? You can use it following this procedure or using specific points of your interest:1.     Go through the list of working processes used in the survey and see if you find any working process on the list interesting for you and are willing to work on its implementation (feel free to contact me for a list of working processes if you haven’t saved them from survey)2.     Go through lists of most used working processes and see if you have all of them (page 60-61)3.     Go through the list of least used working processes and see which you don’t have (page 62-63)4.     Go through the list of most correlated processes and try to identify causality for correlation and see how those are working processes relevant in your academy (page 64-67)5.     If you find a specific working process especially interesting to you, feel free to contact me to reach out for the list of working processes it is correlated with.6.     Go through the list of most recognized indicators of successful transition from academy to the first team and cross-check it with your club (page 70-73).  Looking forward to seeing your opinion, ideas and comments!*you can find publication on this link https://www.linkedin.com/posts/slaven-marasovi%C4%87-075b551b_research-based-on-working-processes-in-academies-activity-6909413896734822400-64VV?utm_source=linkedin_share&utm_medium=member_desktop_web  Development of playersLet’s see our focus on the development of players from two perspectives: “physical” and “decision-making”. If we see graphs beneath how much we are measuring “physical” and how much do we measure “decision-making” level we can conclude that we are much more focused on “physical” although players using, they physic as well as their “decision making” during the playing and training process. So, we obviously create development plans for the “physical” side but do we have development plans for “decision-making”. If we don’t measure what are players’ strengths and weaknesses in the “decision-making” level how we can help them improve it or can we plan their role on the pitch during the game in the best possible way. When we know weaknesses and strengths (characteristics of players), we can plan development for players but also his or her role on the pitch from both, “physical” and “decision-making” perspective. So, better decision making, better performance on the pitch. I suggest you think and discuss within the club about including measurement of IQ and assessment of player’s personality in your working processes within the academy as well as working on development plans from that perspective! In any business, people are the key to the success so help them to develop as much as possible.Let’s see data from the research about the topic. Physical

No alt text provided for this image

If we see how much clubs do assess players about their physical capacities, we see that 98% of clubs surveyed do assess. There is one club in the survey that didn’t have an academy within the club which means that 100% of clubs that do have an academy assess players on their physical capacities. If we see how much clubs assess technical capacity (not pure physical) we will see the percentage is less but still high.

No alt text provided for this image

  Decision-makingOn the other side if we see how much is assessed “decision-making” level we will see that interest is less with more “decision-making” characteristics assessed.

No alt text provided for this image

Players’ personality is assessed by 82% of clubs, while any kind of entrance psycho test is done in 35% of clubs.

No alt text provided for this image

Finally, IQ is measured in just 6% of clubs!

No alt text provided for this image

  If you want to implement this process within your club, the process could be:

  1. Create a team that includes coach expert, pedagogue expert and psychology expert at minimum
  2. Measure IQ and have an assessment of players’ personality after signing (google “assessment center”)Make a development plan for each playerInclude players’ characteristics about decision making in his training and players’ game plan
  3. Regularly measure and report on development.

In the implementation of these processes, it is strongly recommended to have an expert in psychology included in the process.    If you want to see does IQ has an influence on performance on the pitch, I suggest additional reading:http://aassjournal.com/article-1-910-en.pdf; Nima Nakisa (1), Mahboobeh Ghasemzadeh Rahbardar (2)(1) Faculty of Physical Education and Sport Sciences, Kish International Campus, University of Tehran, Kish Island, Iran; (2) Mashhad University of Medical Sciences, Mashhad, Iranhttps://www.frontiersin.org/articles/10.3389/fpsyg.2021.629827/full James Kenneth Bowman(1)*, R. Thomas Boone(2), Scott Goldman(3) and Alex Auerbach(4);(1) Great Neck Public Schools, Great Neck, NY, United States; (2) College of Arts and Sciences, University of Massachusetts – Dartmouth, North Dartmouth, MA, United States; (3) Detroit Lions, Detroit, MI, United States; (4) Toronto Raptors, Toronto, ON, Canada

*You can google as well: “IQ and sports performance” “How to develop IQ” “How to improve decision making”

Read More

Recent Posts

  • TOP 100 European football clubs by enterprise value
  • Hamstring injuries in professional football: Summary of research that tracked causes through 21 seasons.
  • Example of scouting report
  • AnaLysis of City, Arsenal and Liverpool
  • Difference between Arsenal, Liverpool and Manchester city on the pitch in the 2021/2022 season through the statistics.

Recent Comments

No comments to show.

Archives

  • March 2025
  • February 2024
  • April 2023
  • December 2022
  • July 2022

Categories

  • Club managment
  • Footbal sport methodologies
  • Football specific services
  • Football sport policy
  • Strategy

©2022 MANAGEMENT OF FOOTBALL